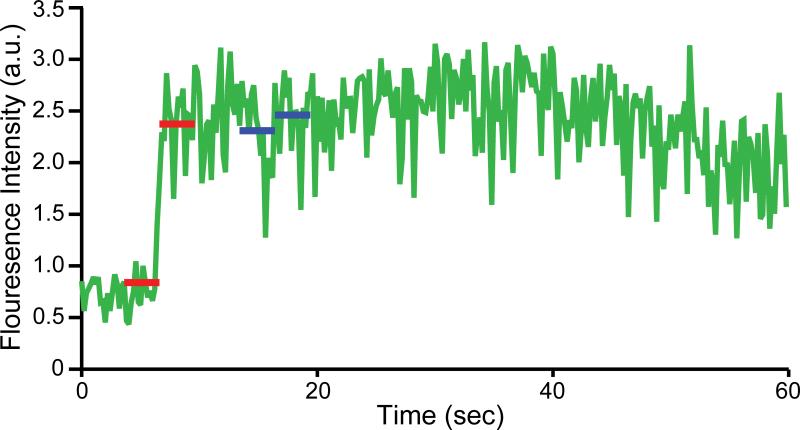
Fig. 3.
Automated step-increase detection. An example of a content dye fluorescence intensity time trace is shown. Two red lines indicate a step increase greater than a set threshold as determined by the local noise level. The two blue lines represent false-positives that are automatically excluded by the Wald-Wolfowitz test [31].

