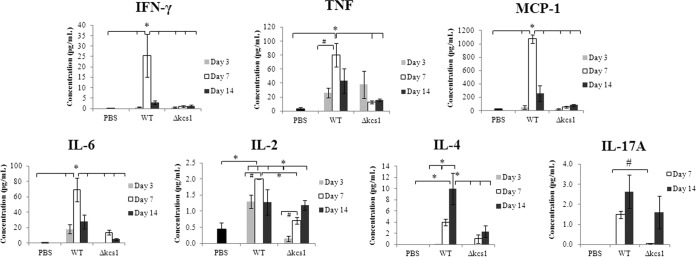
FIG 7 .

Cytokine profile in mock (PBS)-, WT-, and Δkcs1 mutant-infected mouse lung. Lungs of control and C. neoformans-infected mice (3 mice/strain/time point) were homogenized, and the concentrations of the indicated cytokines in the supernatant were measured using a cytometric bead array. The IL-10 responses on all days and the IL-17A response at day 3 for both the WT- and the Δkcs1 mutant-infected mice were below the level of sensitivity (not shown). *, P < 0.05 using a one-way analysis of variance (ANOVA) and a Tukey-Kramer multiple-comparison test; #, P < 0.05 using a two-tailed Student t test.
