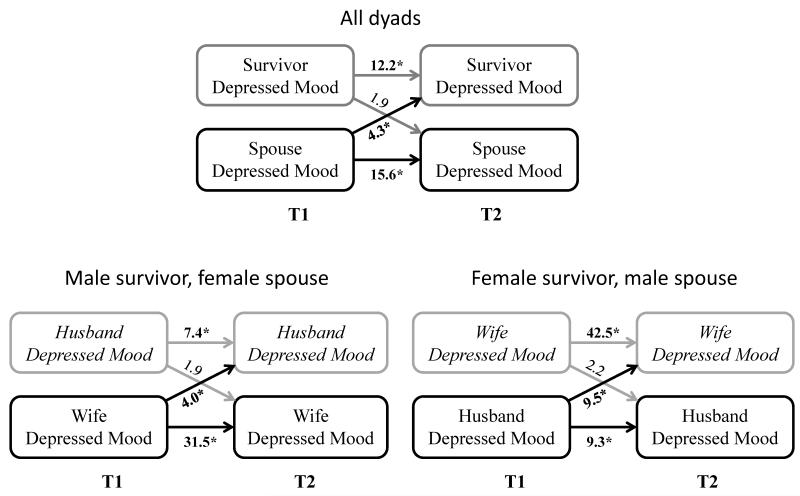
Figure 3.
Association between depressed moodand partners’ subsequent depressed mood, Medical Expenditures Panel Survey (2004-2012). *p<0.05; Estimates represent odds of depressed mood at T2 in those with depressed mood at T1 (actor effects) or spouses with depressed mood at T1 (partner effects), compared to without depressed mood at T1. T1 and T2 were 11 months apart, on average. Models control for age, gender, race/ethnicity, health insurance coverage, % federal poverty level, family size, presence of health conditions, presence of basic/instrumental activities of daily living limitations, cancer type, survivor treatment status, MEPS panel number, and depressed mood at T1.

