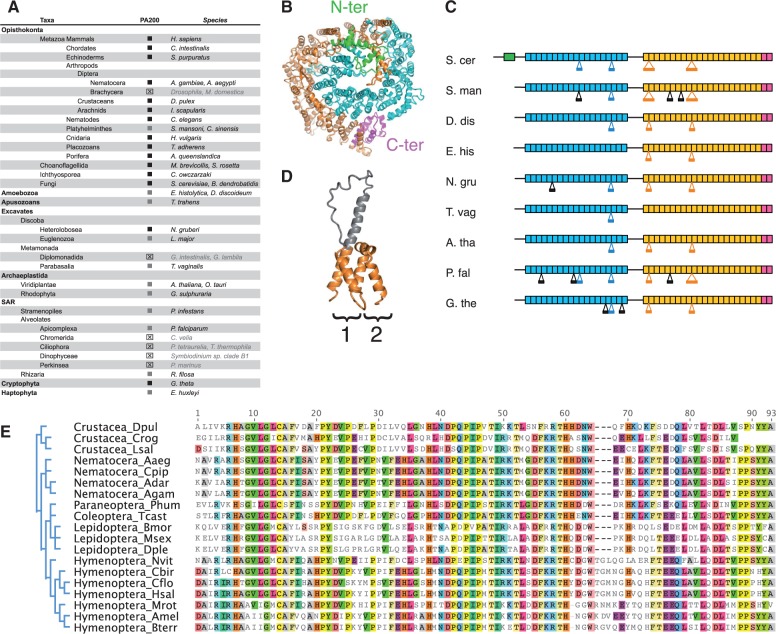
Fig. 4.—
PA200 distribution and losses in eukaryotic supergroups. (A). Synopsis of PA200 distribution in major supergroups. Sequences were identified by reciprocal Blast searches. Black squares: E-values lower than e−80, gray squares: E-values between e−8 and e−80. ⊠: homologous sequences not found. Taxonomy is indicated on the left and the corresponding species on the right. Names of species missing PA200 are grayed. (B) Crystal structure of proteasome activator Blm10/PA200 from Saccharomyces cerevisiae (S. cer) (Sadre-Bazzaz et al. 2010) when viewed from the top of the complex with the 20S proteasome (which is omitted for the sake of the clearness). The structure represents a long curved α-solenoid folded on itself. The Blm10/PA200 crystal structure lacks two unstructured regions that link the N-terminal (green), the first α-helical (blue) and the second α-helical one (yellow), ended by the conserved C-terminal Pfam PF11919 domain (magenta). (C) Schematic representation of Blm10/PA200 proteins from different organisms. The upper S. cer protein has the known 3D structure while the others were deduced based on the sequence similarities with the S.cer protein. Rectangles denote α-solenoid structures with HEAT repeats. The color code is the same as on panel B. Black lines connecting the rectangles show regions that were not resolved by the X-ray crystallography. Large insertions of more than 40 residues into the core of the α-solenoids are shown below the rectangular boxes. The insertions that are observed in the 3D structure are colored, while ones that are predicted based on the sequence alignment are in black. The predicted insertions may have structures as shown on panel (D). S. man, Schisostoma mansoni (Platyhelminthes); D. dis, Dictyostelium discoideum (Amoebozoa); E. his, Entamoeba histolytica (Amoebozoa); N. gru, Naegleria gruberi (Heterolobosea); T. vag, Trichomonas vaginalis (Parabasalia); A. tha, Arabidopsis thaliana (Viridiplantae); P. fal, Plasmodium falciparum (Alveolates); G.the, Guillardia theta (Cryptophyta). (D) An example of a large insertion (gray color) into the HEAT repeat unit (1) in comparison with a typical HEAT repeat unit (2). (E) Absence of PA200 in Brachycera insects. Alignment of PA200 orthologs showed that the C-terminus is highly conserved among arthropods and if present, should have been detected in Brachycera.

