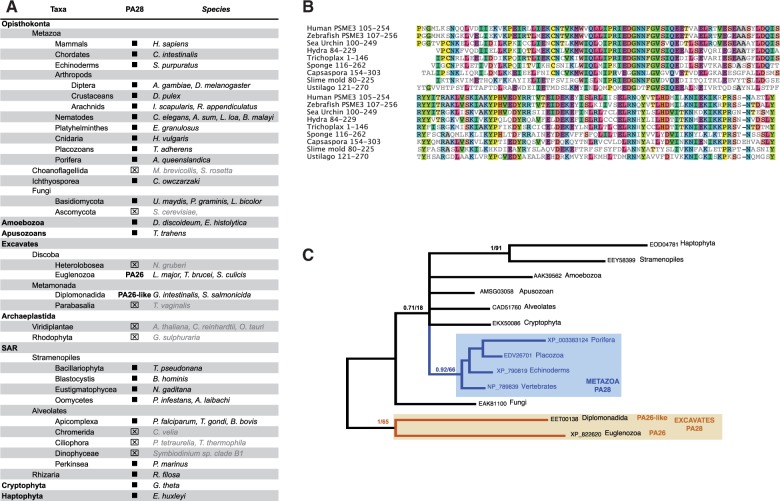
Fig. 5.—
PA28 distribution and losses in eukaryote subgroups. (A) Synopsis of PA28 distribution in major supergroups. Sequences were identified by reciprocal Blast searches. Black squares: E-values lower than e−80. ⊠: homologous sequences not found. Taxonomy is indicated on the left and the corresponding species on the right. Names of species missing PA200 are grayed. The putative ortholog of the Trypanosoma PA26 is indicated as PA26-like. (B) Sequence alignment of PA28 in Opisthokonts, showing the high conservation of the150 C-terminal amino acids. (C) Phylogenetic relationships of Excavate PA26 relative to PA28 from other supergroups. MrBayes and ML trees were generated from PA28 and PA26 C-terminal sequences MSA. Only PP values above 0.7 are indicated.

