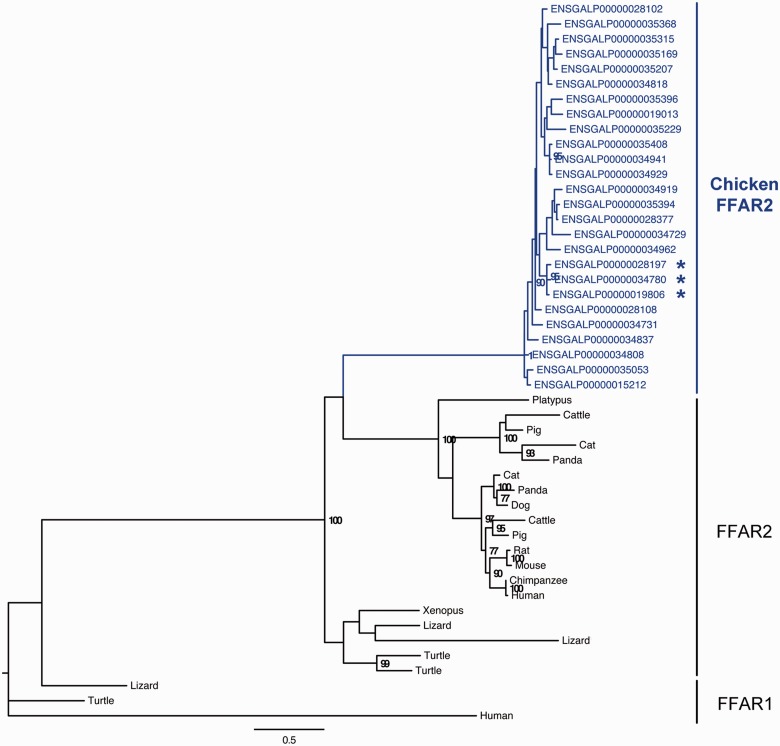
Fig. 2.—
Phylogenetic tree of FFAR2 paralogous genes. The phylogenetic tree was reconstructed using PhyML (Guindon and Gascuel 2003). Bootstrap values are given when nodes are strongly supported (>70%). The scale represents the substitution rate. The sequence with an * has a specific insertion of eight amino acids (DNGSEADG) at the following positions: ENSGALP00000034780 (163-170), ENSGALP00000028197 (152-159), and ENSGALP00000019806 (158-165).

