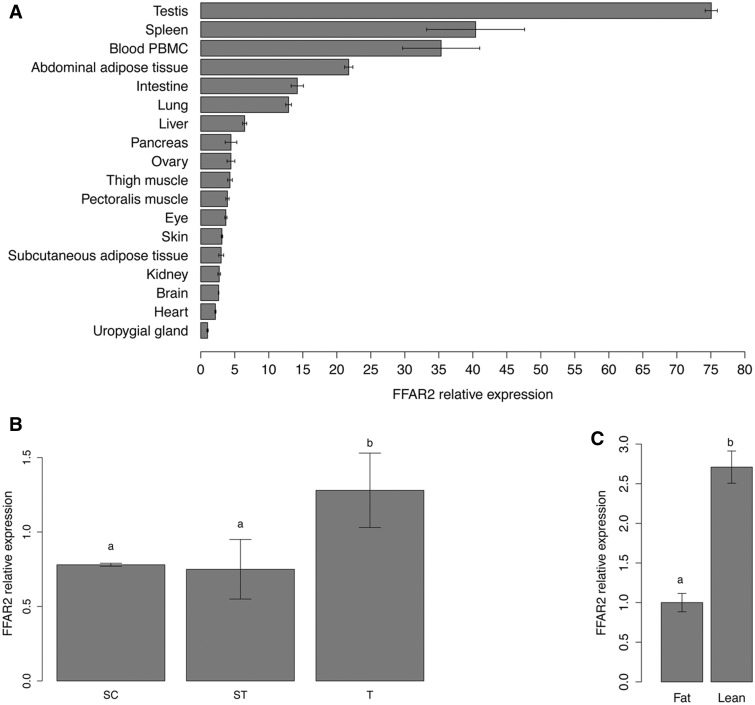
Fig. 5.—
FFAR2 mRNA expression in different tissues in chicken (A), in chicken Sertoli cells, seminiferous tubules, and whole testis (B), in adipose tissue of lean and fat divergent lines (C). Relative tissue abundances of FFAR2 genes were examined by RT-qPCR using “universal” primers able to amplify the 26 sequences of FFAR2. The ribosomal subunit 18 S, RPL15, and GAPDH were used as reference genes. Y axis indicates relative level of mRNA expressed in comparison to the lowest level observed (Uropygial gland [A], seminiferous tubules [B], and fat chickens [C]). Error bars indicate standard deviation between three biological replicates (A), three independent experiments performed in triplicate (B), and ten animals (C). Different letters indicate significant expression difference (P < 0.05).

