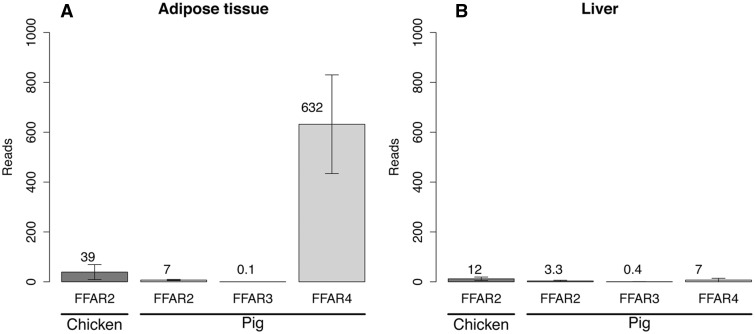
Fig. 6.—
FFAR expression in chicken and pig using RNA-Seq in adipose tissue (A) and liver (B). Values correspond to the mean of eight individual expression counts (four males and four females). Chicken FFAR2 reads are the sum of all the paralog expression counts. Errors bars indicate standard deviation between individual reads.

