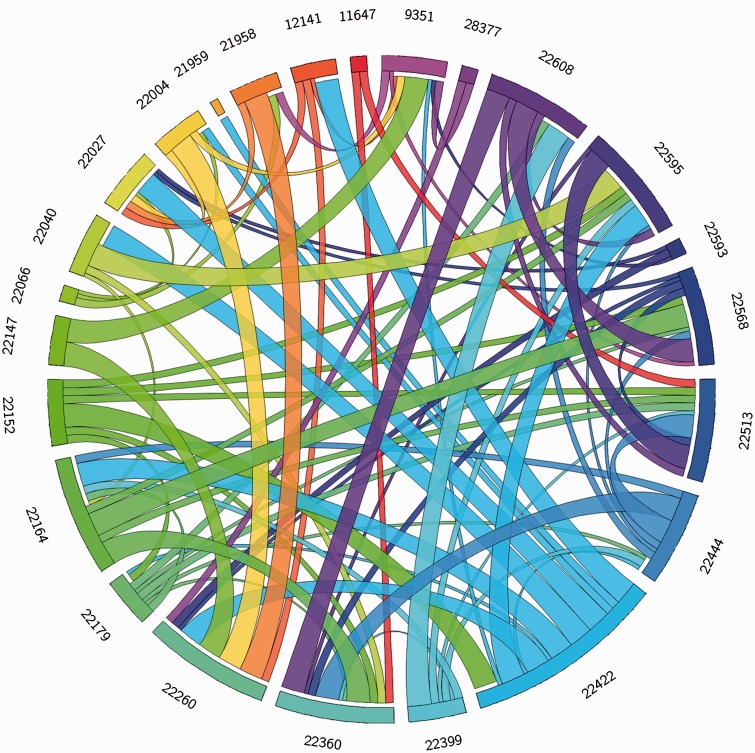
Fig. 7.—
Gene conversion events in the FFAR2 cluster. Each line represents a gene and each ribbon represents a gene conversion event between two genes of the FFAR2 cluster. The thickness of the ribbon represents the significance of each identified fragment. The biggest, medium and smallest ribbons represent the fragments identified with three, two and one significant P values, respectively. For clarity, Ensembl gene IDs are shortened. The correspondence between reduced gene ID, gene ID, and protein ID can be found in the supplementary data S1, Supplementary Material online. The coordinates of each fragment can be found in the supplementary data S9, Supplementary Material online. Note that only the 24 genes involved in at least one gene conversion event are represented.

