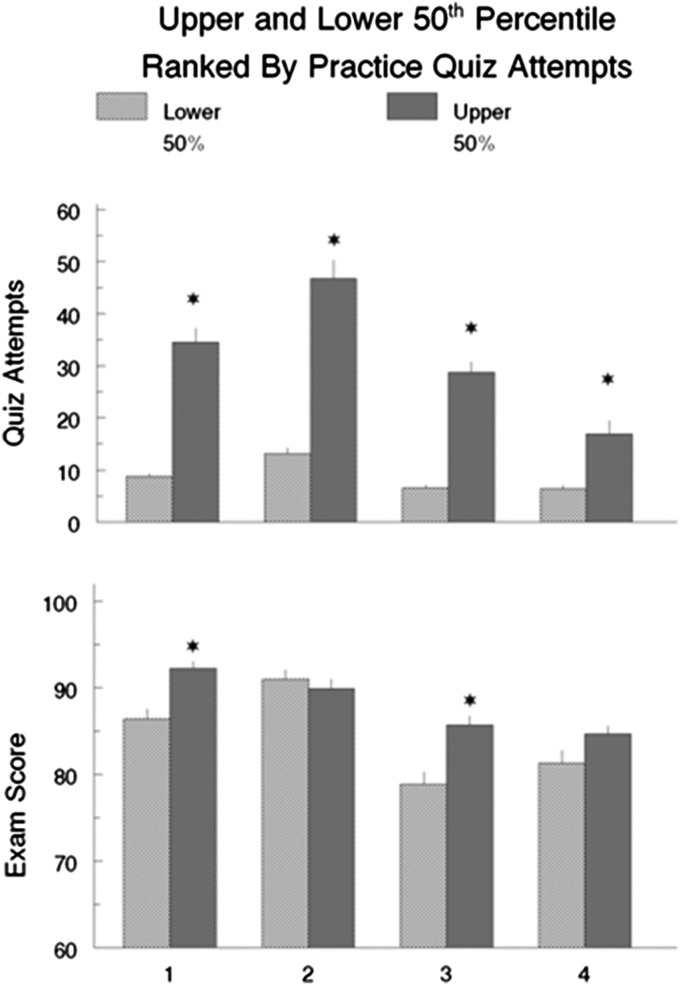
Figure 1.
Comparison of upper and lower 50th percentile of class on the number of practice quiz attempts (upper graph), and subsequent examination score (lower graph) during the 4 testing blocks. The star represents when the upper and lower percentiles were significantly different (p<0.05) in either the upper or lower panels.

