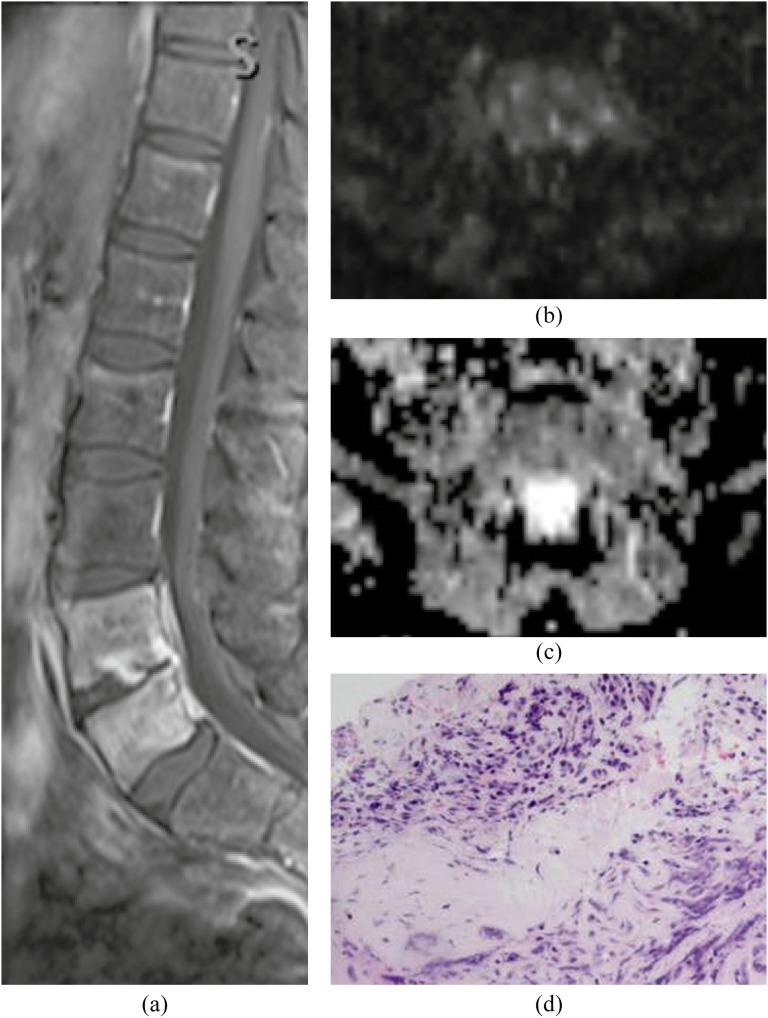
Figure 15.
Vertebral osteomyelitis. (a) Sagittal post-contrast T1 weighted image with fat saturation shows enhancement in the disc and vertebral bodies at L4 and L5 consistent with discitis/osteomyelitis. (b, c) There is mild hyperintensity on diffusion-weighted imaging (b) with increased apparent diffusion coefficient (c) in the adjacent bone marrow. (d) Pathology demonstrates extensive bone necrosis and oedema with patchy inflammatory cell infiltrations.

