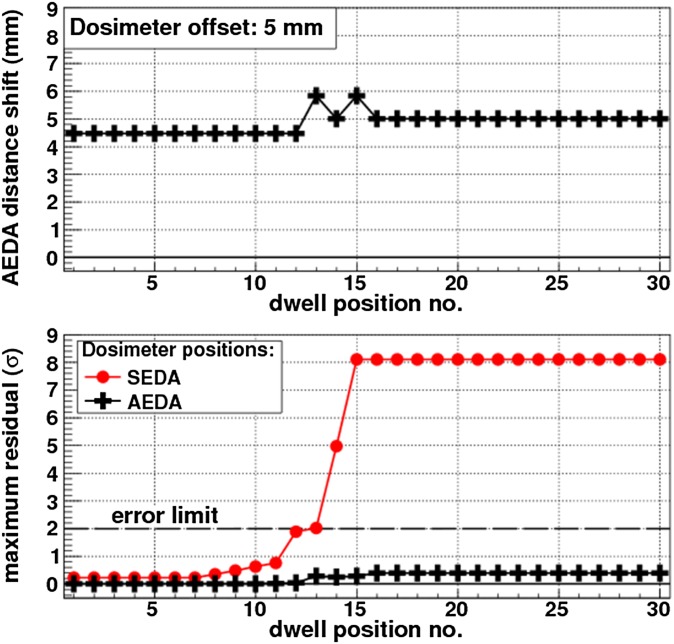
Figure 5.
Example of adaptive error detection algorithm (AEDA) and static error detection algorithm (SEDA) responses to a simulated false error treatment case, where the dosemeter was shifted by 5 mm. The top plot shows the accurate geometric feedback of the most viable accurate dosemeter position provided by the AEDA, the AEDA distance shift. The bottom plot shows that the maximum residual from the AEDA response does not break the statistical error criterion, whereas that from the SEDA does. The maximum residual is expressed in units of one standard deviation of the total uncertainty budget. Reproduced from Kertzscher et al21 with permission from American Association of Physicists in Medicine.

