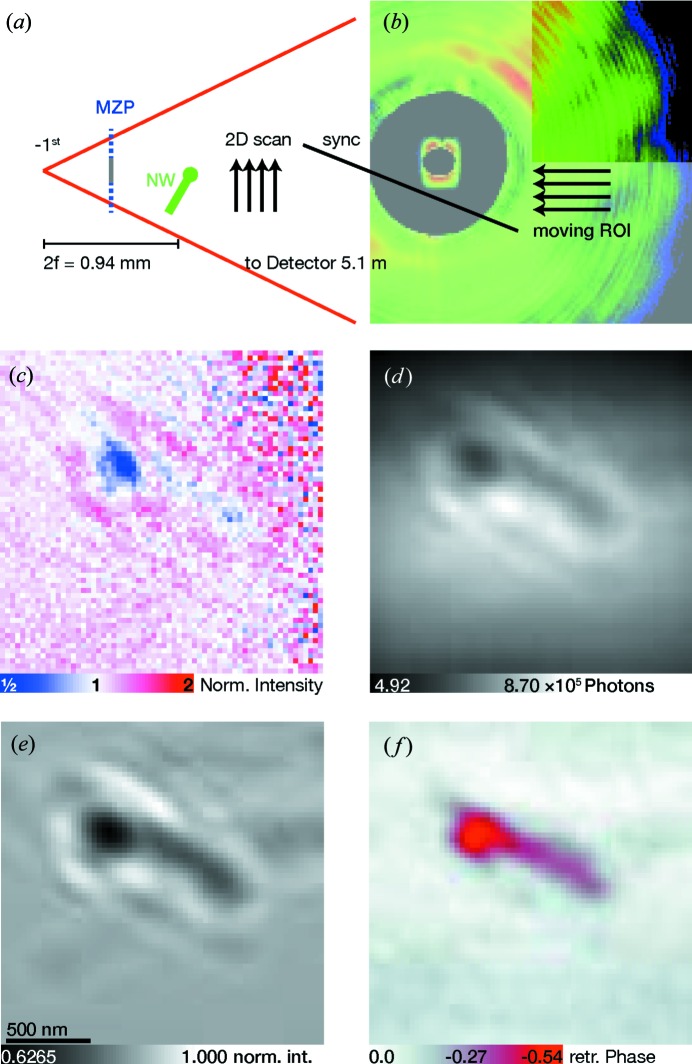
Figure 4.
Holographic imaging of a nanowire. In (a), the illumination by the −1st-order MZP beam and the two-dimensional raster scan is shown. A typical detector image is shown in (b); the highlighted region of interest is a co-moving ROI linked to the raster scan. Part (c) shows a flat-field-divided ROI with a large noise floor due to the short illumination time. The image in (d) shows the correlated average of 1647 illuminations, flat-field corrected in (e). From this, the phase can be reconstructed by holography and a phase-retrieval algorithm, with the result shown in (f).

