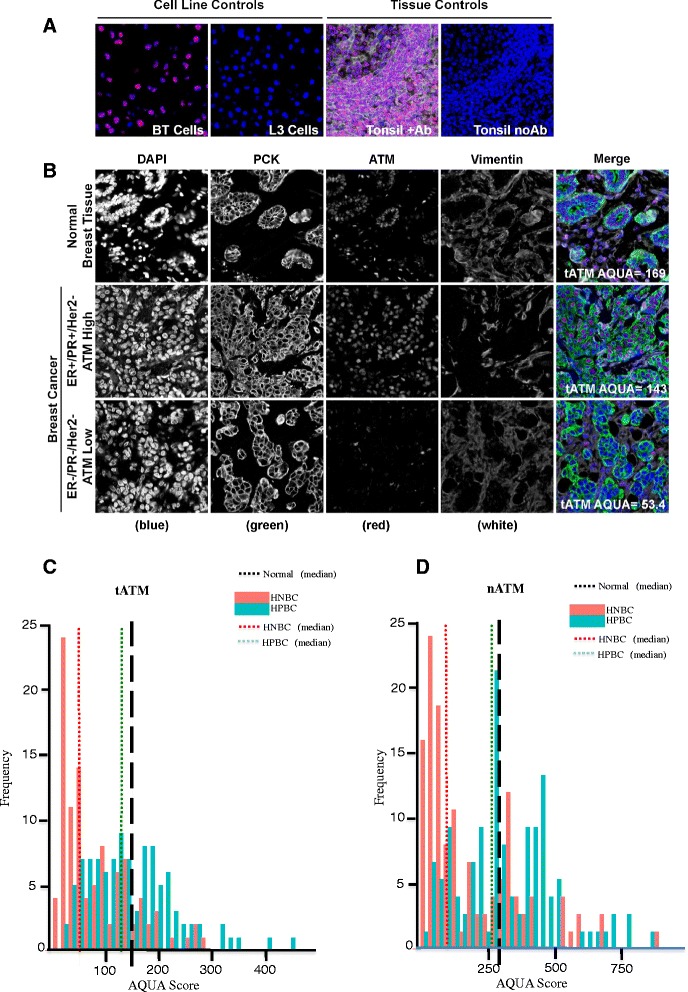
Figure 1.

Quantitative fluorescence immunohistochemistry and digital image analysis for ATM in EBC. (A) Control ATM antibody specificity staining in ATM-positive BT cells and ATM-deficient L3 cells, as well as in breast cancer tissue with and without primary anti-ATM antibody. (B) Representative fluorescence images for ATM expression in normal breast epithelial tissue and EBC. DAPI-stained nuclei are depicted in blue, pan-cytokeratin-stained epithelial/malignant cells are depicted in green, vimentin-stained nonmalignant tumor stromal cells are depicted in white, and ATM protein expression is depicted in red. Histogram distributions representing tATM expression (C) and nATM expression (D) in both HPBC cohort (green solid bar) and HNBC cohort (red solid bar). The hashed black line represents median ATM expression (tATM and nATM) in normal breast tissue, the hashed green line represents median ATM expression (tATM and nATM) in the HPBC cohort, and the hashed red line represents median ATM expression (tATM and nATM) in the HNBC cohort. ATM, ataxia telangiectasia mutated; DAPI, diamidino-2-phenylindole; EBC, early-stage breast cancer; HNBC, hormone-negative breast cancer; HPBC, hormone-positive breast cancer; nATM, tumor nuclear ATM; tATM, tumor ATM.
