Figure 3.

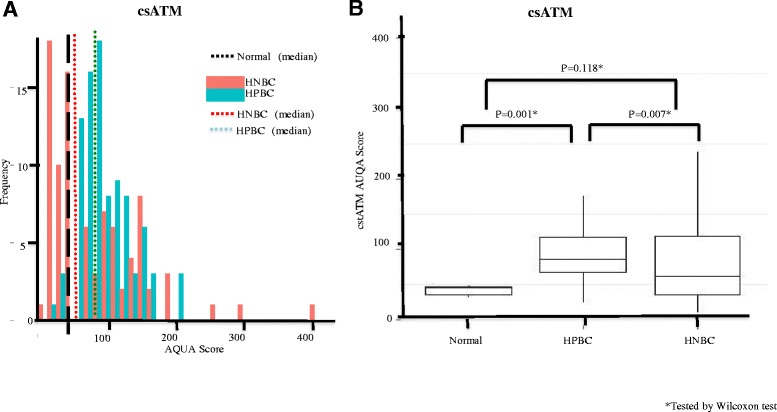
ATM expression in cancer-associated stromal (csATM) in the HPBC and HNBC cohorts compared to its expression in normal stromal adjacent to normal breast epithelium. (A) Histogram distributions representing csATM expression in both the HPBC cohort (green solid bar) and HNBC cohort (red solid bar). The hashed black line represents median csATM expression in normal breast stromal tissue, the hashed green line represents median csATM expression in the HPBC cohort, and the hashed red line represents median csATM expression in the HNBC cohort. (B) Comparison of csATM AQUA scores in normal controls, HPBC cohort and HNBC cohort. AQUA, automated quantitative immunofluorescence analysis; ATM, ataxia telangiectasia mutated; HNBC, hormone-negative breast cancer; HPBC, hormone-positive breast cancer.
