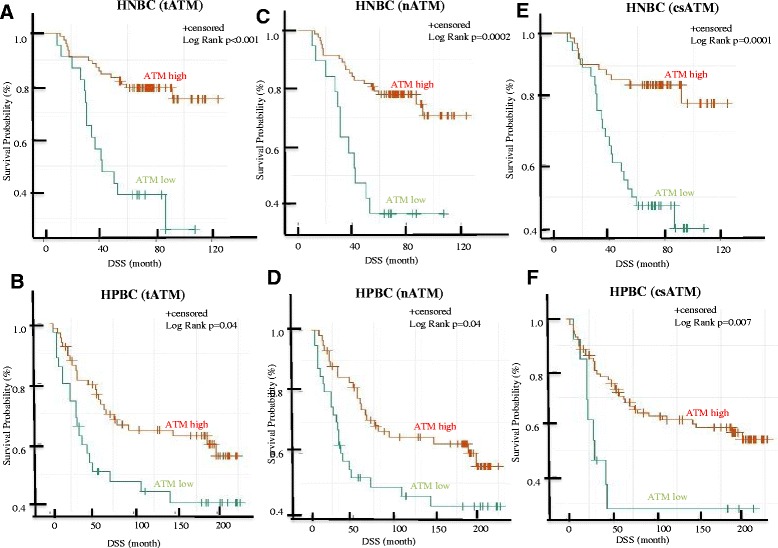
Figure 4.

Univariate survival analysis in the HPBC and HNBC cohorts based on tATM, nATM and csATM expression. Kaplan-Meier (KM) analysis of disease-specific survival (DSS) in the HNBC cohort (A, C, E) and in the HPBC cohort (B, D, F) comparing patients with high and low tATM (A, B), nATM (C, D) and csATM (E, F). ATM, ataxia telangiectasia mutated; csATM, cancer-associated stromal ATM; HNBC, hormone-negative breast cancer; HPBC, hormone-positive breast cancer; nATM, tumor nuclear ATM; tATM, tumor ATM.
