Figure 1.
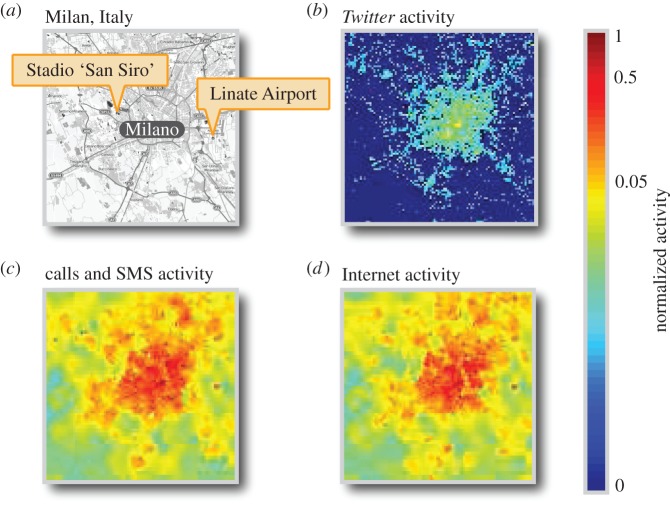
Twitter, calls and SMS, and Internet activity in Milan. (a) We analyse Twitter, calls and SMS, and Internet activity data recorded from mobile phones in the city of Milan and surroundings. The geographical area around Milan for which all these datasets are available is represented in this map, created using data from OpenStreetMap. The datasets cover the period from 1 November 2013 to 31 December 2013. We aim to determine whether such mobile phone data can be used to infer the number of people in a specific location at a specific time. To calibrate our model, we consider two case studies: San Siro football stadium and Linate Airport. (b) We depict the normalized number of tweets recorded during the first week of November 2013, for the geographical area shown in (a). Tweet counts are extracted from the full set of geolocalized tweets sent during this period. We observe a higher density of tweets in the centre of Milan. (c) We depict normalized data on the total number of calls made and received as well as text messages (SMS) sent and received during the time interval between 08.20 and 08.30 of 1 November 2013, for the geographical area depicted in (a). We again observe more activity in the centre of Milan. (d) We depict normalized data on the number of requests made by mobile phones to access the Internet during the time interval between 08.20 and 08.30 of 1 November 2013, for the geographical area shown in (a). Visual inspection of this dataset provides further evidence that more mobile phone activity is recorded in locations where greater numbers of people would be expected. Colours in (b–d) are normalized to the maximum recorded activity level in each dataset.

