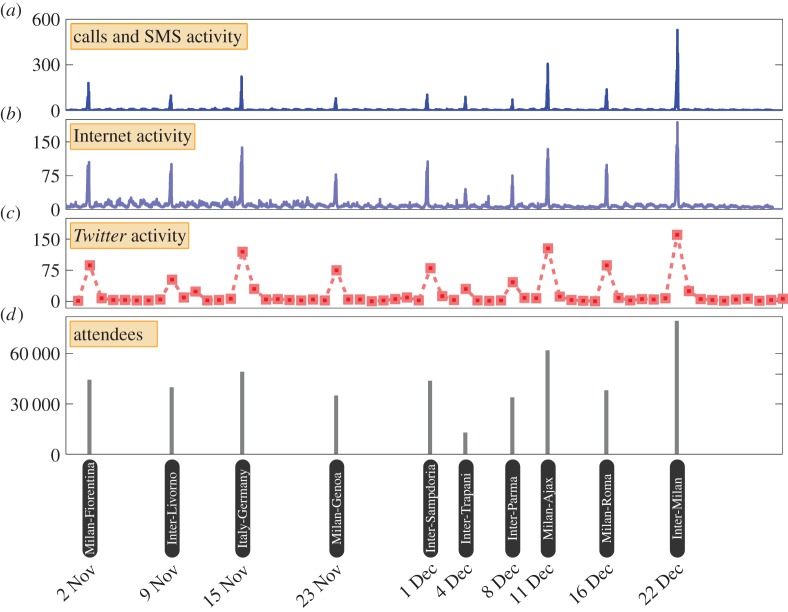
Figure 2.
Mobile phone and Twitter activity in football stadium Stadio San Siro. (a) We depict the time series of mobile phone call and SMS activity recorded in the cell in which the football stadium is located, during the period of analysis between 1 November 2013 and 31 December 2013. The time series is plotted at 10 min granularity. (b) Similarly, we depict the time series of Internet connection activity in the cell in which Stadio San Siro is located, at 10 min granularity. (c) Finally, we depict the daily counts of tweets recorded within the vicinity of the stadium. (d) We determine the dates of football matches which took place during this period, and plot the number of attendees which were recorded at each of these matches. Visual inspection reveals a remarkable alignment between the spikes that can be observed in the communication activities and the dates on which football matches took place. The heights of the spikes bear a strong similarity to the number of attendees at each match.

