
Figure 4.
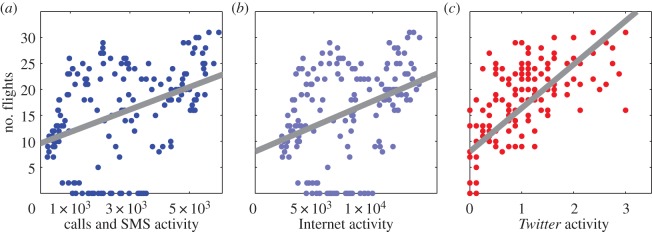
Parallel analysis of the relationship between mobile phone and Twitter data and the number of passengers at Linate Airport. (a) We create a proxy indicator for the number of passengers at Linate Airport in each hour by calculating the number of flights departing in the following 2 h or arriving in the previous hour. We compare this proxy indicator to the average mobile phone call and SMS activity recorded for each hour in a week, in the cells in which the airport is located. We find that greater activity corresponds to a greater estimated number of passengers (adjusted R2=0.175, N=168, p<0.001, ordinary least-squares regression). The relationship we find is weaker than that found for the football attendance figures, but remarkable given the coarse nature of our estimate of the number of passengers. (b) We then explore the relationship between the proxy indicator of the number of passengers and Internet connection activity recorded in the cells in which the airport is located. Again, we find that greater Internet activity corresponds to a higher number of passengers (adjusted R2=0.143, N=168, p<0.001, ordinary least-squares regression). (c) As a final example, we consider Twitter activity recorded in the cells in which the airport is located. Again, we consider the average number of tweets recorded during each of the 168 hours in a week, over the eight week period of our analysis. Here, we find a stronger relationship between the estimated number of passengers and activity on Twitter (adjusted R2=0.510, N=168, p<0.001, ordinary least-squares regression).