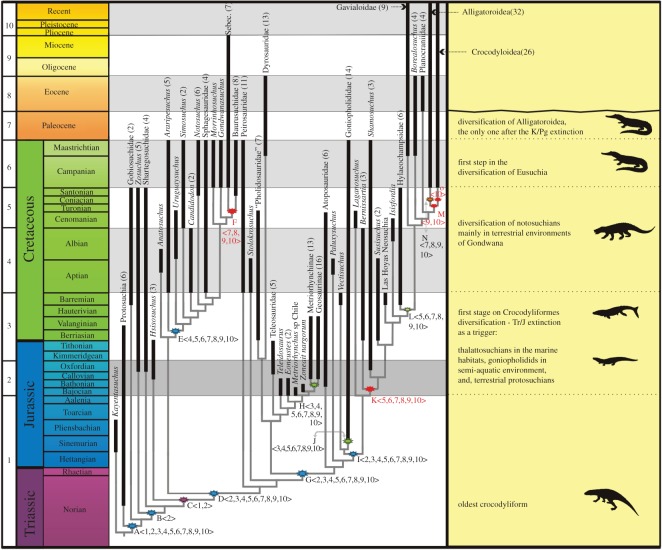
Figure 1.
Summary of the Crocodyliformes phylogeny depicting diversification events. Each terminal taxon has its fossil record, represented by black lines, depicted against geological time. Clades are collapsed and numbers in parentheses represent the total number of terminal taxa within each branch (some clades are represented by the name of higher level groups and others by the name of a genus within the clade). The node related to clades for which diversification shifts were obtained in the analyses are marked—the colour assigned to the symbol matches the colour of the period related to the shift and red was assigned to those interpreted as artefacts. Numbers within < > correspond to the intervals on which these shifts were identified. The ages of cladogenetic events, within the grey lines, do not correspond to time intervals in which they are depicted on the figure. Names of clades related to shifts identified in the analysis—A: Crocodyliformes; B: unnamed clade (all taxa more closely related to Zosuchus than to Gobiosuchus); C: unnamed clade (Hsisosuchus+Mesoeucrocodylia); D: Mesoeucrocodylia; E: Notosuchia; F: Sebecosuchia; G: Neosuchia; H: Metriorhynchidae; I: unnamed clade (all taxa more closely related to Goniopholis than to Theriosuchus); J: Goniopholididae; K: unnamed clade (all taxa more closely related to Bernissartia than to Laganosuchus); L: Eusuchia; M: Brevirostrines; N: Alligatoroidea; O: Crocodyloidea.

