
Figure 4.
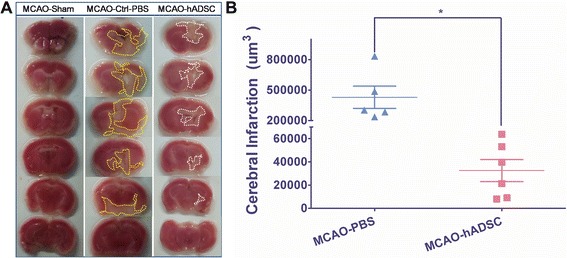
Brain infarction volume determined by TTC staining. Representative TTC staining pictures of mouse brain within each group (A), and the statistical analysis by Scion Image Software (B). * means significant differences were found between groups (P <0.05). TTC, 2,3,5-triphenyltetrazolium chloride.