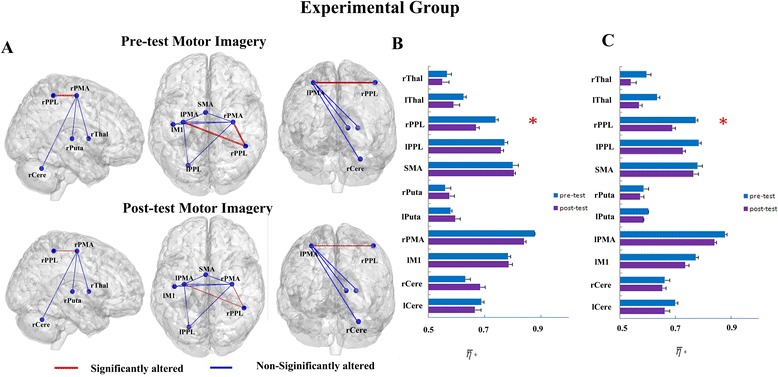
Figure 2.

The functional connectivity, η, between the lPMA/rPMA and other ROIs of pre-tests and post-tests in imagination task of the experimental group. (A) The surface visualization of all 12 ROIs. Red indicates η was significantly altered after motor imagery training, while blue indicates η was not significantly altered after motor imagery training. (B) The η of pre-tests and post-tests between the lPMA and other ROIs (* represents significant alterations, corrected p < 0.01). (C) The η of pre-tests and post-tests between the rPMA and other ROIs (* represents significant alterations, corrected p < 0.005).
