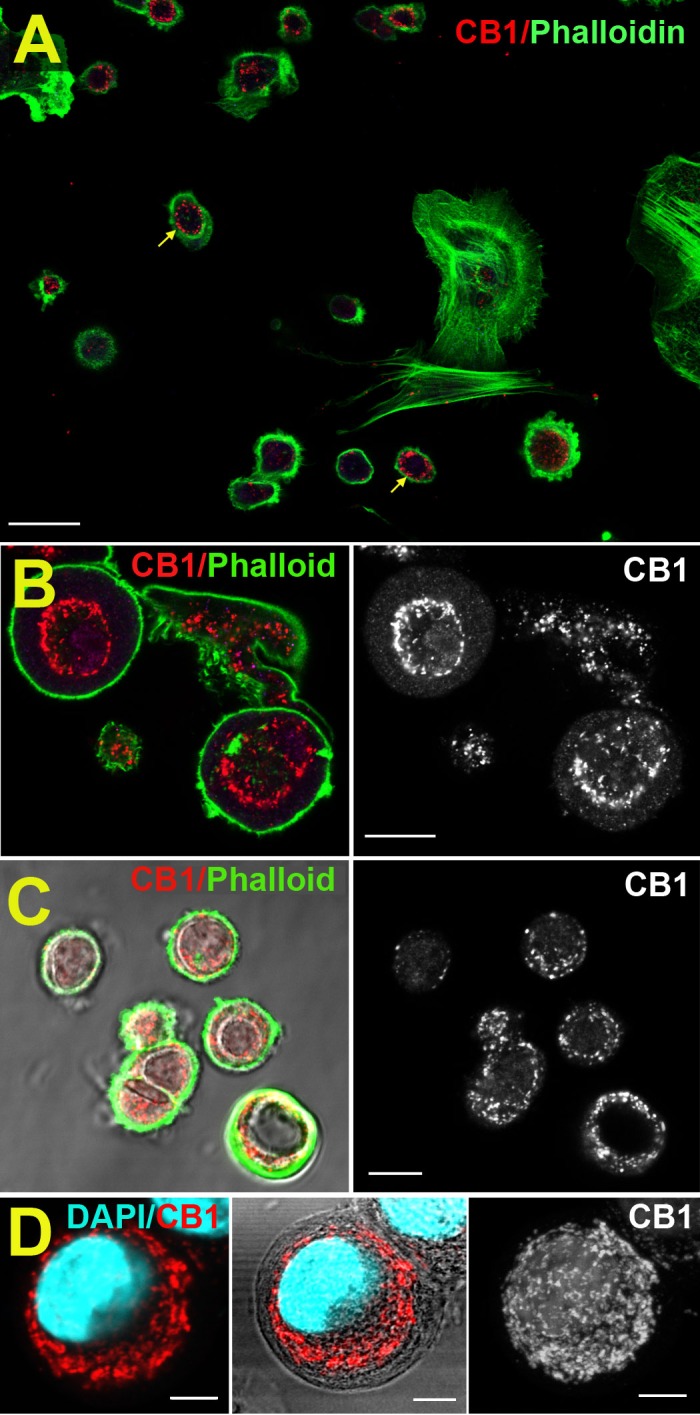
Figure 4.

CB1 protein expression in cultured bCECs. (A) Overview shows CB1 expression (red, arrows) in a subset of cultured bCECs, outlined by phalloidin (green). (B) Higher magnification image shows ring-like CB1 expression (red). (C) CB1/phalloidin overlaid on DIC image (left); CB1 only (right). (D) CB1/DAPI (left). Same with DIC (middle). Flat Z stack of CB1 in same cell (right). Scale bars: 20 μm (A), 10 μm (B, C), 5 μm (D).
