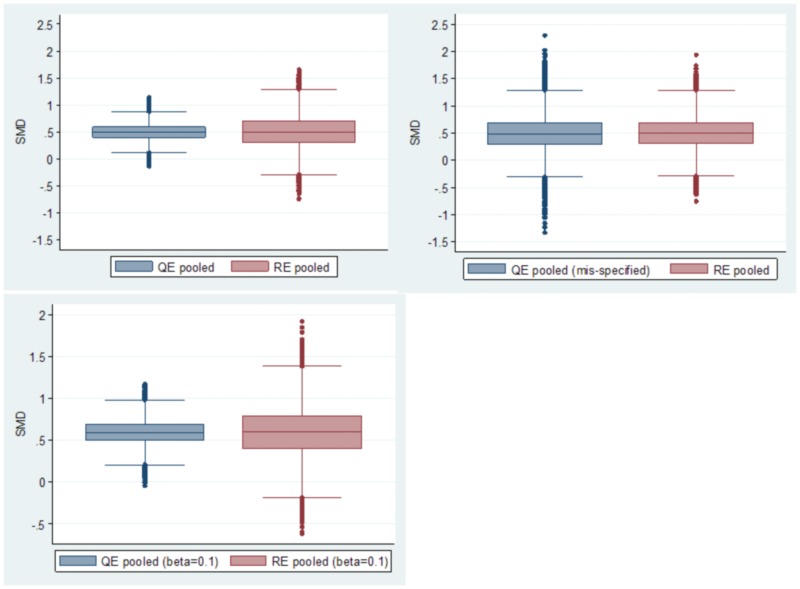
Figure 3.
Comparison of the distribution of pooled estimates by the quality effects model when β = 0 (top left panel; simulation 1) and mis-specified quality effects model when β = 0 (top right panel; simulation 2) in comparison to the RE model. The bottom panel (simulation 3) represents the constraint that β = 0.1. Each panel represents a separate simulation run with 50,000 iterations involving 250,000 individual studies.

