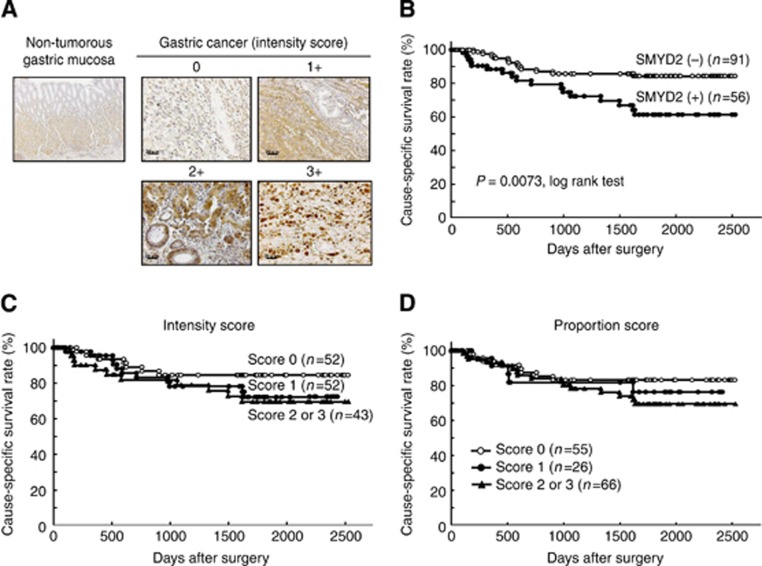
Figure 3.
(A) Specific immunostaining of SMYD2 protein in a representative primary tumor sample. Based on this result, the intensity scores for SMYD2 staining were determined as follows; 0=negative, 1=weak, 2=moderate, 3=strong). Scale bar: 20 μm. (B–D) Cause-specific survival rates of gastric cancer patients (as determined by Kaplan–Meier plots) depending on the scores of the intensity (C), proportion (D) and in combination (B) based on the immunostaining analysis of their cancers. The log-rank test was used for statistical analysis. P<0.05 is considered statistically significant.

