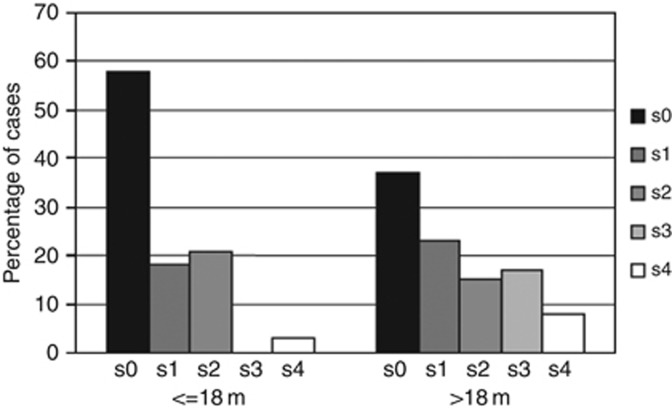
Figure 1.
Distribution of the number of SCAs in tumours of patients under and over 18 months of age at diagnosis. On the left side the number of tumours without (s0) or with (s1, s2, s3, s4) SCAs in patients less than 18 months at diagnosis, on the right side the number of tumours without (s0) or with (s1, s2, s3, s4) SCAs in patients over 18 months. The graph shows that tumours of older patients have increased number of SCAs, in particular three or more SCAs per tumour.

