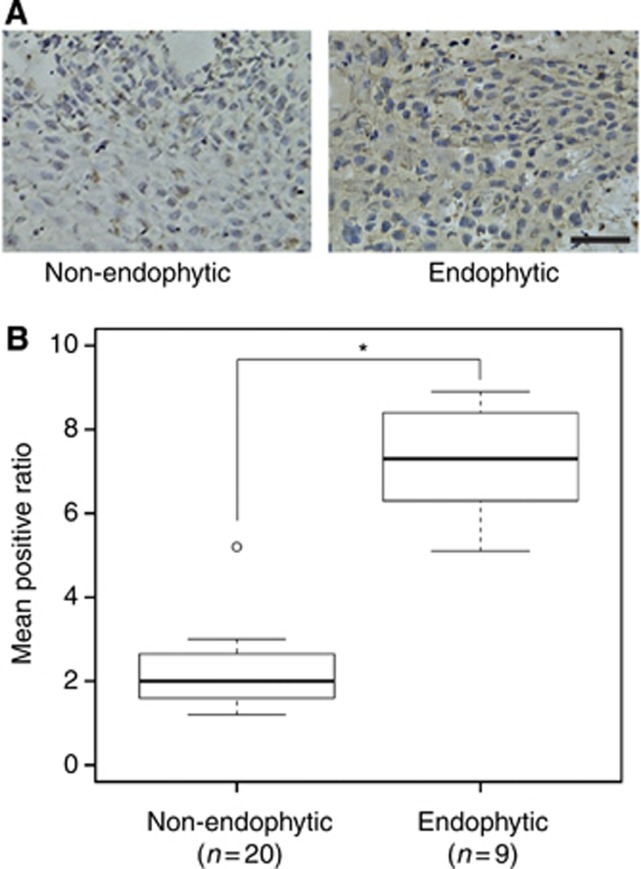
Figure 2.
Immunohistochemistry analysis of PARVB protein expression in 29 samples. (A) Left panel, non-endophytic tissue with weak staining in a few cells; right panel, endophytic tissue with strong staining in most of the cells. Scale bar: 100 μm. (B) Result of IHC analysis showing expression of PARVB was significantly higher in endophytic tumours than in non-endophytic tumours (*P<0.0001).

