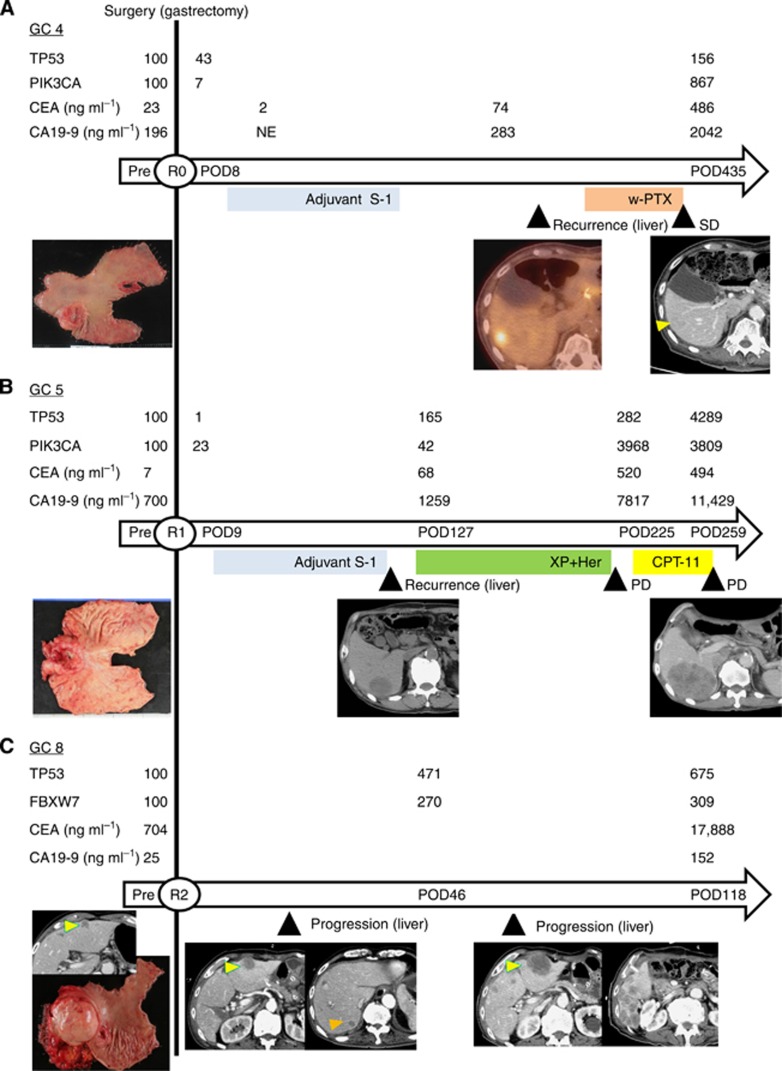
Figure 2.
The relationship between ctDNA and clinical observations during the treatment course. ctDNA values during the clinical course are depicted in comparison with serum tumour markers, treatment, response, and tumour burden (specimen photos and radiological images). The horizontal arrows indicate the time scale for each case. The day of gastrectomy is represented by the vertical line. The presence or absence of tumour after surgery is described by the R status (R0: no residual tumour, R1: microscopic residual tumour, R2: macroscopic residual tumour). The intervals from surgery are indicated inside the arrows. Chemotherapy is depicted by colour bars under the time scale. The specimen photos depict the resected stomach, representing the tumour burden before surgery. CT (A, B, and C) and positron emission tomography (PET)-CT (A) images display the status of metastatic liver tumours at each assessment point, indicated by triangle markers. In each case, ctDNA is expressed as the percent relative to the ctDNA values before surgery. POD: postoperative day, PD: progressive disease, XP: capecitabine+cisplatin, Her: trastuzumab, CPT-11: irinotecan, w-PTX: weekly administration of paclitaxel. (A) The ctDNA fraction was measured for both TP53 (c.103delT) and PIK3CA (c.1633G>A). (B) The ctDNA fraction was measured for both TP53 (c.747G>C) and PIK3CA (c.1633G>A). (C) The ctDNA fraction was measured for both TP53 (c.155G>T) and FBXW7 (c.1177C>T).

