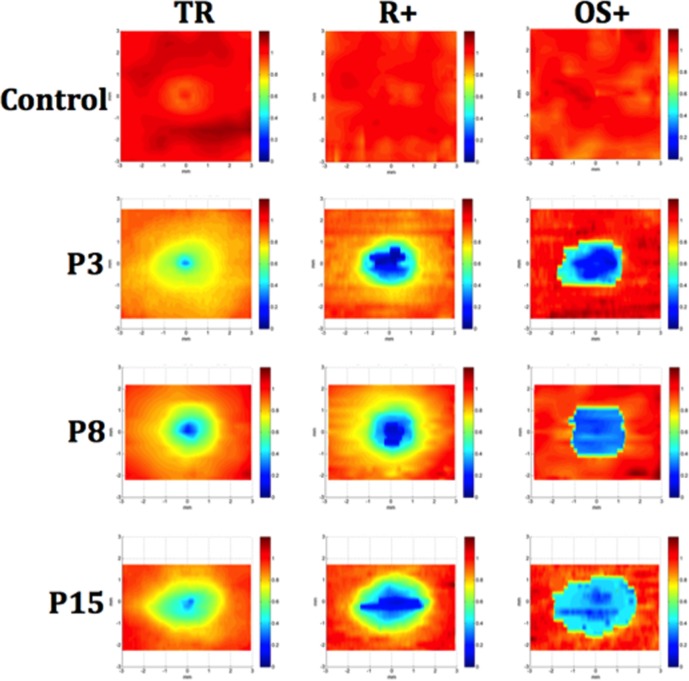
Figure 7.
Normalized thickness maps for SD-OCT volume scans from a control and 3 representative patients (P3, P8, and P15) for TR, R+, and OS+ layers. The maps show normalized thickness, where dark blue is 0% of normal and dark red is 120% of normal. Thinning progressing from the periphery toward the center can be seen for all three layer measurements, with the most severe central thinning seen in the OS+ map.

