FIG 10 .
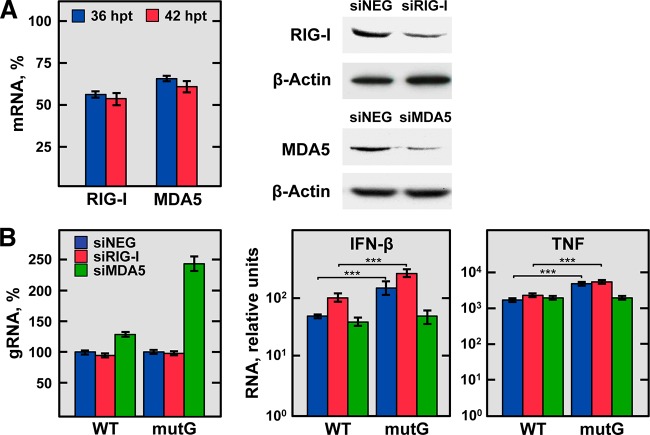
Effect of silencing the expression of RIG-I-like receptors on TNF and IFN-β production during rTGEV-WT and rTGEV-mutG infection. ST cells were transfected twice with a negative-control siRNA, an siRNA previously validated for porcine RIG-I, or an siRNA designed for porcine MDA5. After 24 h of the second transfection, cells were noninfected or infected with rTGEV-WT (WT) and rTGEV-mutG (mutG) viruses. Total RNA and proteins were extracted at 12 and 18 hpi (36 and 42 h after the second siRNA transfection, respectively) to evaluate the silencing, virus production, and mRNA levels of TNF and IFN-β. (A) Silencing of RIG-I and MDA5. Silencing at the mRNA level (left) was evaluated at 36 (blue) and 42 (red) h after the second transfection of the siRNAs by RT-qPCR and expressed as the percentage of RIG-I and MDA5 mRNA remaining after the silencing of target genes in comparison to reference levels from cells transfected with the negative-control siRNA. RIG-I and MDA5 silencing at the protein level (right) was evaluated by immunoblotting at 42 h after the second transfection of the RIG-I and MDA5 siRNAs (siRIG-I and siMDA5, respectively) in comparison to cells transfected with the negative-control siRNA (siNEG). The β-actin was used as a loading control. (B) Effect of RIG-I and MDA5 silencing on virus genomic RNA, IFN-β, and TNF production. Virus genomic RNA (gRNA) and IFN-β and TNF mRNA levels were quantified by RT-qPCR in cells transfected with the negative-control (siNEG; blue bars), RIG-I (siRIG-I; red bars), or MDA5 (siMDA5; green bars) siRNAs and infected with rTGEV-WT (WT) or rTGEV-mutG (mutG) viruses. Levels of virus gRNA are expressed as percentages in comparison with the gRNA levels in nonsilenced and infected cells (left). IFN-β and TNF mRNA levels are relative to those in nonsilenced and noninfected cells (right). The figure shows the effects observed at 18 hpi (42 h after the second siRNA transfection), when they were more evident. In all cases, GUSB mRNA levels were used as the endogenous control. Errors bars indicate standard deviations from three independent experiments. ***, P < 0.001.

