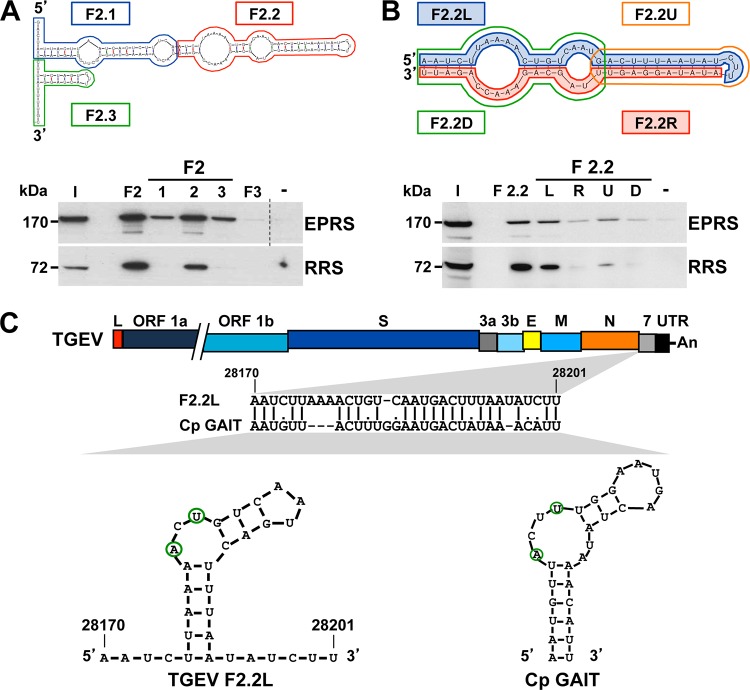
FIG 3 .
Mapping of the RNA domains interacting with EPRS and RRS. (A) Mapping of the region within F2 interacting with ERPS and RRS. F2 was divided into three fragments (F2.1, F2.2, and F2.3) that were used as bait in pulldown assays, together with fragments F2 and F3 or without RNA (−) as specificity controls. The presence of EPRS and RRS in the initial extract (I) and in the pulled-down fractions was analyzed by Western blotting. To simplify the information in the figure, an empty lane was removed in the EPRS panel, in which the dashed line indicates the splicing site. The molecular masses in kDa of EPRS and RRS are indicated at the left. (B) Identification of the F2.2 domain interacting with EPRS and RRS. F2.2 was divided into four fragments (F2.2L, F2.2R, F2.2U, F2.2D), and their interactions with EPRS and RRS were analyzed by pulldown assays and Western blotting. The same experiment was performed with fragment F2.2 or without RNA (−) as specificity controls. The molecular masses in kDa of EPRS and RRS are indicated at the left. (C) Sequence analysis of fragment F2.2L. The bar on the top represents the TGEV genome, in which the different genes (ORF 1a, ORF 1b, S, 3a, 3b, E, M, N, and 7 genes), the leader sequence (L), and the 3′ UTR are illustrated as boxes. The sequence alignment of the viral fragment F2.2L with the GAIT element of the ceruloplasmin (Cp GAIT) and their respective secondary structures, in which the A and U residues critical for the function of the GAIT element are outlined in green, are shown. Numbers above the sequence alignment and in the secondary structure indicate the genome position of fragment F2.2L.

