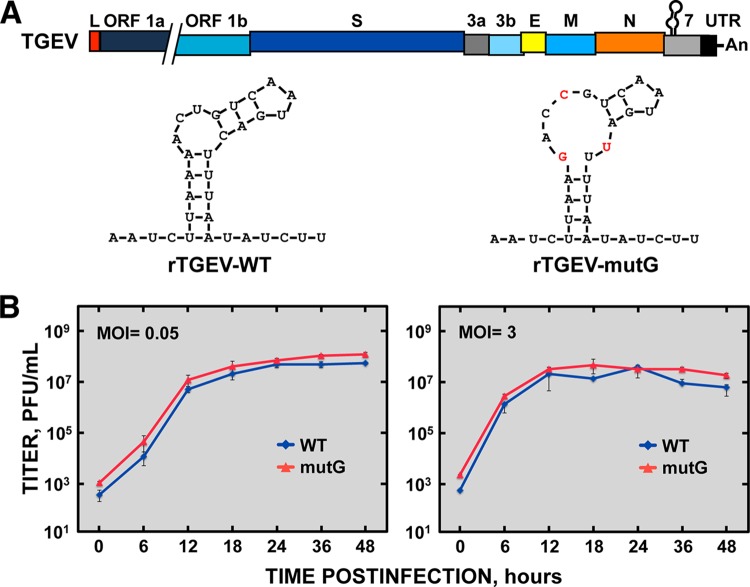
FIG 7 .
Characterization of rTGEV-mutG virus in cell culture. (A) Genetic structure of rTGEV-mutG virus. The bar on top represents the TGEV genome, in which the different genes (ORF 1a, ORF 1b, S, 3a, 3b, E, M, N, and 7 genes), the leader sequence (L), the 3′ UTR, and the GAIT-like RNA motif are indicated. The structures depicted below the genome show the sequence and predicted secondary structure of the GAIT-like RNA motif from the WT (rTGEV-WT) and mutant (rTGEV-mutG) viruses, where the mutations introduced in the mutant are indicated in red. (B) In vitro growth kinetics of the WT and mutant viruses. ST cells were infected at an MOI of 0.05 (left) and 3 (right) with rTGEV-WT (WT) and rTGEV-mutG (mutG) viruses, and at different times postinfection the viral titer was determined by plaque titration on ST cells. Error bars represent the standard deviations from three independent experiments.

