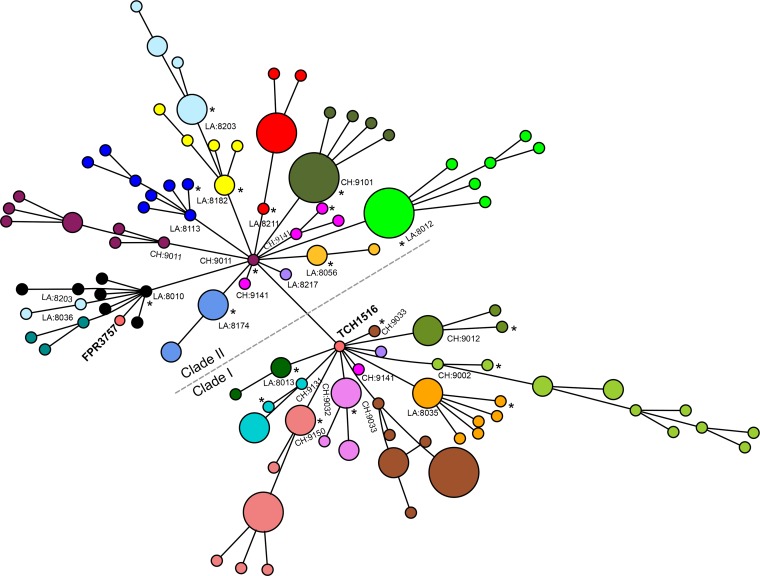
FIG 3 .
Minimum spanning tree showing genetic relationships among all household USA300 isolates. Each circle represents an individual genotype based on a 1,335,849-bp core gene alignment, and each color represents a different household. The size of the circle is proportional to the number of isolates with the genotype indicated. The household numbers are prefixed with CH (for Chicago) or LA (for Los Angeles). The index infection isolate in the household is indicated by an asterisk. The clades of USA300 strains with and without the grlA 80Y and gyrA 84L mutations are labeled clades I and II, respectively. As shown, the isolates from Los Angeles household 8203 split into two clusters but still remained in larger clade II. The isolates from Chicago household 9141 separated into two different clades with the presence or absence of grlA and gyrA mutations.

