
FIG 2 .
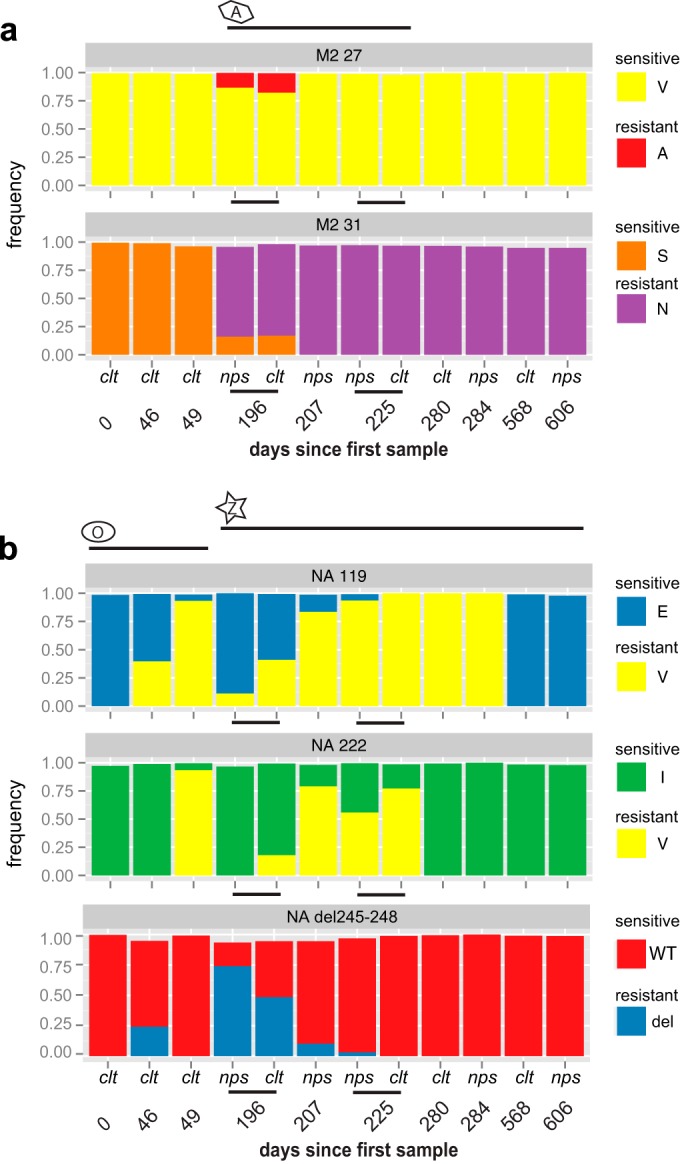
Plots of drug resistance frequency. Histograms representing the frequency of ion channel blocker mutations (a) and neuraminidase inhibitor mutations (b) on Ion Torrent sequence reads. A, amantadine treatment; O, oseltamivir treatment; Z, zanamivir treatment. Black lines track the length of time for which the patient was treated with each drug. nps, nasopharyngeal swabs; clt, culture isolates.