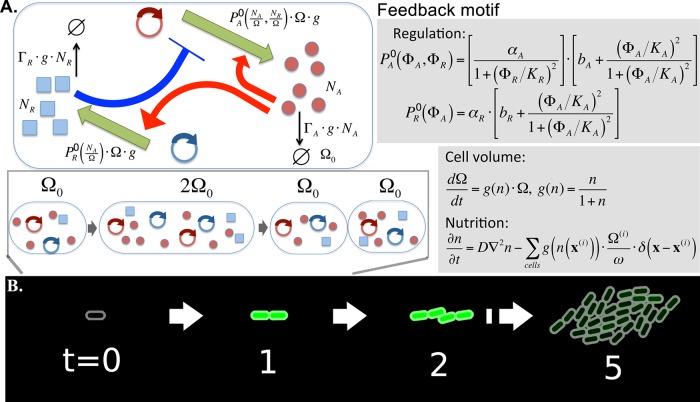
FIG 1 .
Schematic description of the model. (A) Activator A activates its own transcription and transcription of R, while R represses the transcription of A. Numbers of protein A, NA, and protein R, NR, were simulated stochastically. The cell volume is denoted by Ω; hence, the densities of proteins A and R are given by and , respectively. The production rates of A and R are assumed to be and , respectively, where includes the effect of the activation and repression with Hill coefficient 2. The proportionality to cell volume Ω is due to the assumption that the gene copy number grows with the cell volume, while the proportionality to cell growth rate g is introduced as the simplest way to include the slowing down of the metabolism with the nutrition availability. Similarly, the active degradation of the protein is assumed to be proportional to g(n). The cell volume grows exponentially with nutrition (n)-dependent growth rate. The time unit is chosen so that the highest growth rate in very rich medium becomes unity. The nutrients diffuse with diffusion rate D and are consumed by the growing cells, with a proportionality constant between the growth rate and consumption rate of ω. A cell division happens when volume Ω reaches the threshold 2Ω0, and proteins are stochastically separated to the two daughter cells. (B) As cells divide, cells interact mechanically to push each other, and eventually form a nearly circular colony.

