FIG 4 .

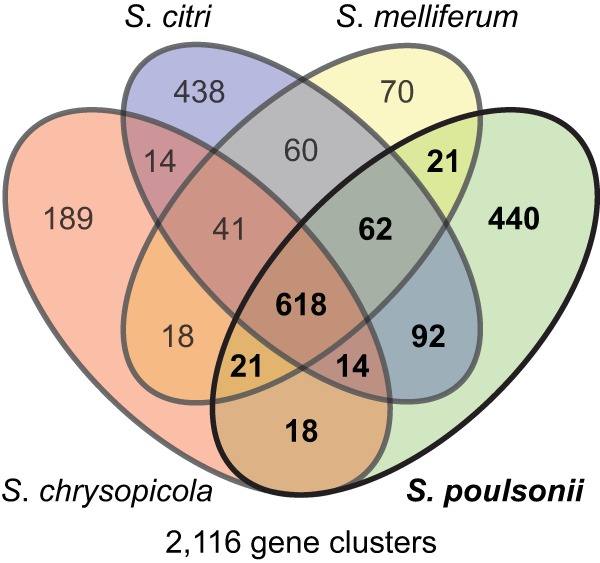
Numbers of shared and genome-specific homologous gene clusters. The Venn diagram shows the numbers of shared and genome-specific homologous gene clusters among the S. poulsonii, S. citri, S. melliferum, and S. chrysopicola genomes.

Numbers of shared and genome-specific homologous gene clusters. The Venn diagram shows the numbers of shared and genome-specific homologous gene clusters among the S. poulsonii, S. citri, S. melliferum, and S. chrysopicola genomes.