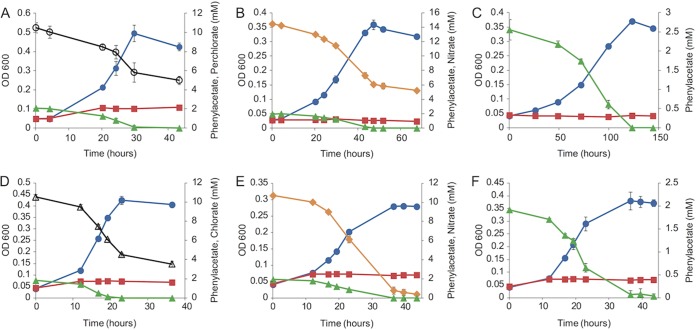
FIG 2 .
Growth curves of S. selenatireducens strain CUZ (A to C) and D. chlorophilus strain NSS (D to F) with 2 mM phenylacetate in the presence of perchlorate (A), chlorate (D), nitrate (B and E), or oxygen (C and F) as the electron acceptor. Blue circles, cell density; red squares, cell density of the no-acceptor control; green triangles, phenylacetate concentration; black open circles, perchlorate concentration; black open triangles, chlorate concentration; orange diamonds, nitrate concentration. Points and error bars represent the average and standard deviation of triplicate samples. OD 600, optical density at 600 nm.

