
FIG 3 .
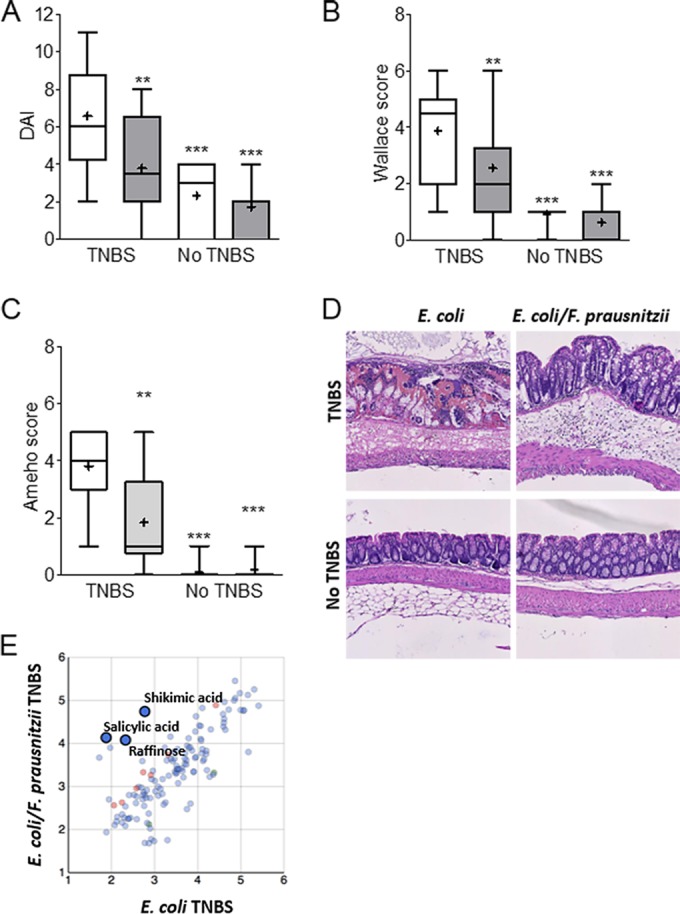
Analysis of colonic responses to a TNBS-induced colitis. (A) Disease activity index (DAI), (B) Wallace macroscopic score, (C) Ameho histologic score, (D) representative hematoxylin-eosin-safran staining of colonic tissue sections from E. coli-monoassociated (white bars) (n = 16 and 12) and E. coli/F. prausnitzii-diassociated (gray bars) (n = 18 and 11) mice with or without colitis, respectively. (E) Metabolomic analysis of E. coli-monoassociated (n = 8) compared to E. coli/F. prausnitzii-diassociated (n = 9) mouse colon content after TNBS treatment. The values are expressed as box-and-whisker plots with interquartile range, with the top portion of the box representing the 75th percentile and the bottom portion representing the 25th percentile. The horizontal bar within the box represents the median, with the mean shown as “+.” Asterisks indicate significant differences: **, P ≤ 0.01; ***, P ≤ 0.001. Metabolomics results are expressed as log intensities of metabolites with KEGG ID (t test, red and green, P ≤ 0.05).