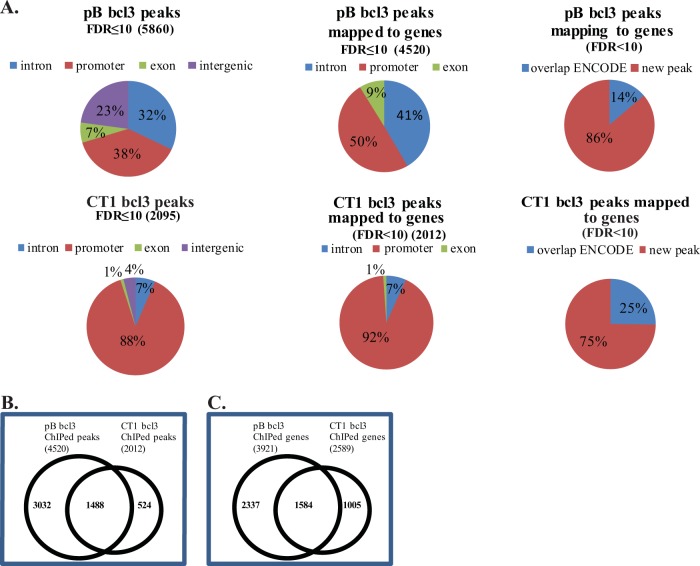
FIG 3 .
Distribution of bcl3 peaks. (A) Distribution of peaks with FDRs of <10 across the genome, those mapped to genes (within 2 kb of start site or within intron or exon) and those that overlap ENCODE bcl3 peaks. (B) Overlap of bcl3 peaks between the pB-containing and CT1-expressing cells. (C) Overlap of genes ChIPed by bcl3 in the pB-containing and CT1-expressing cells.

