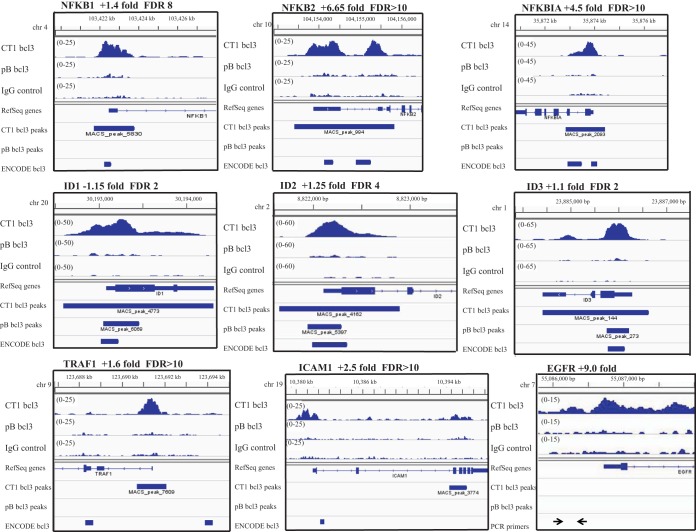
FIG 4 .
Visualization of bcl3 peaks called by MACS. A representation of peaks called for bcl3 in the CT1-expressing and pB-containing cells, showing the height of the peak, location on the genome, gene bound, and bcl3 peaks in the ENCODE database. The gene is listed with the fold change by RNA-Seq and the FDR of the peak called by MACS for the CT1-expressing cells. For the EGFR gene, the locations of primers used to check chromatin for known NF-κB sites are shown.

