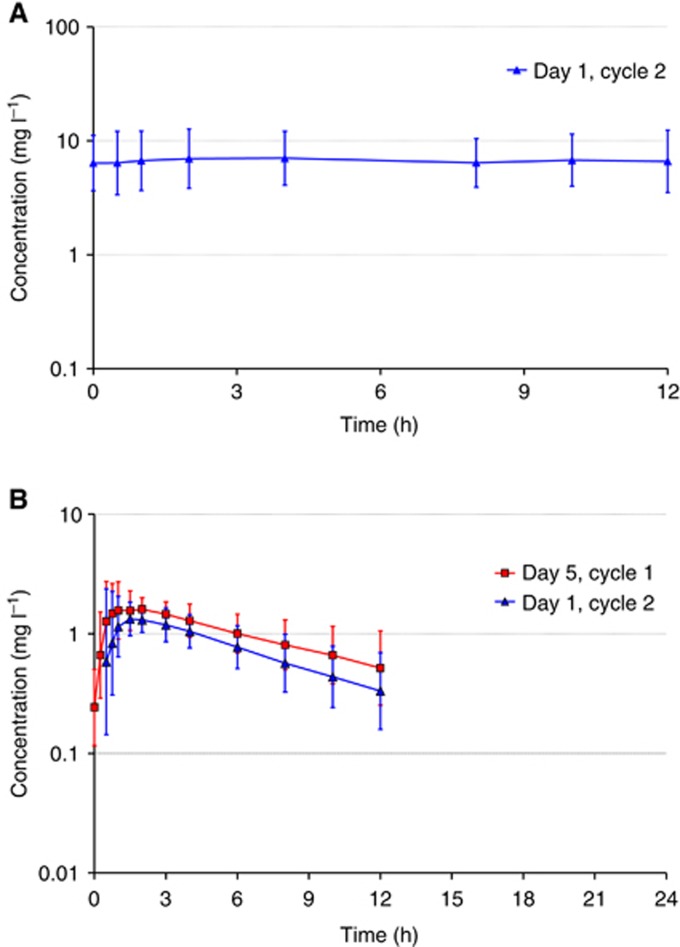
Figure 2.
Pharmaockinetics of sorafenib and cyclophosphamide. (A) Plasma concentrations of sorafenib following multiple doses of 400 mg per b.i.d. sorafenib in combination with 50 mg of cyclophosphamide and 2.5 mg of letrozole on Day 1 of Cycle 2 (geometric means, geometric s.d.; n=13). (B) Plasma concentrations of cyclophosphamide (*) following multiple doses of 50 mg of cyclophosphamide in combination with 2.5 mg of letrozole without (Day 5, Cycle 1) and after concomitant treatment (Day 1, Cycle 2) with multiple oral doses of 400 mg per b.i.d. sorafenib (G.M.=geometric means, G.s.d.= geometric standard deviation; n=13) *More than one-third of individual plasma concentrations were below LLOQ at 24 h after dosing on both profile days. No corresponding geometric mean concentrations was calculated.

