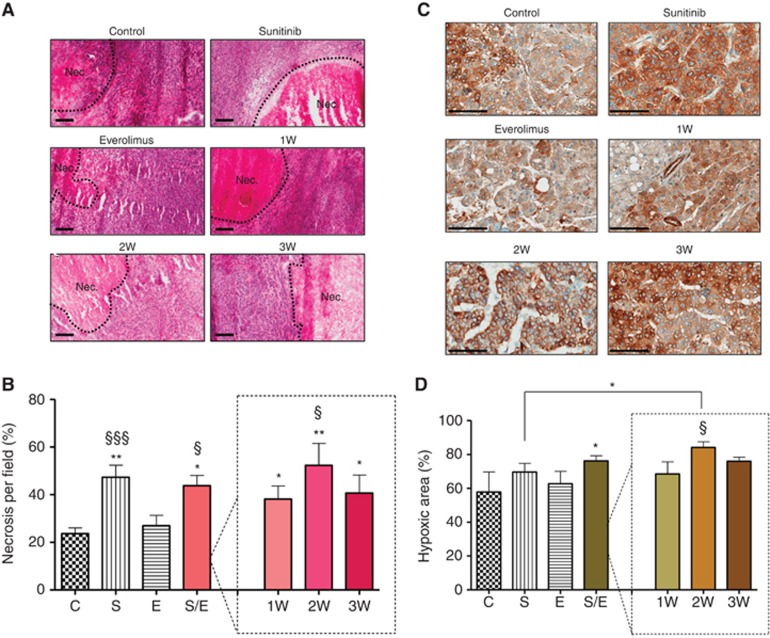
Figure 3.
Immunohistochemistry analysis of Caki-1 tumour sections stained with HE and for CA-IX. Representative pictures of HE staining (A) and CA-IX (C) for each group of treatment. Bar graph is 200 μM for HE staining and 100 μM for CA-IX staining. Necrosis (B) and hypoxia (D) were quantified by Image J software for mice with tumours treated with vehicle control (C), 60 mg kg−1 per day sunitinib (S), 10 mg kg−1 per day everolimus (E), sequential combination of 60 mg kg−1 per day sunitinib, and 10 mg kg−1 per day everolimus as a single group (S/E) composed with treatment of alternate drugs administration every week (1W), every 2 weeks (2W), and every 3 weeks (3W). Values represent the means±s.e.m. of at least five quantifications per animal with five animals per group, * Symbol stands for P-values relative to control and § symbol stands for analysis relative to everolimus, ** or §§P<0.01, * or §P<0.05.

