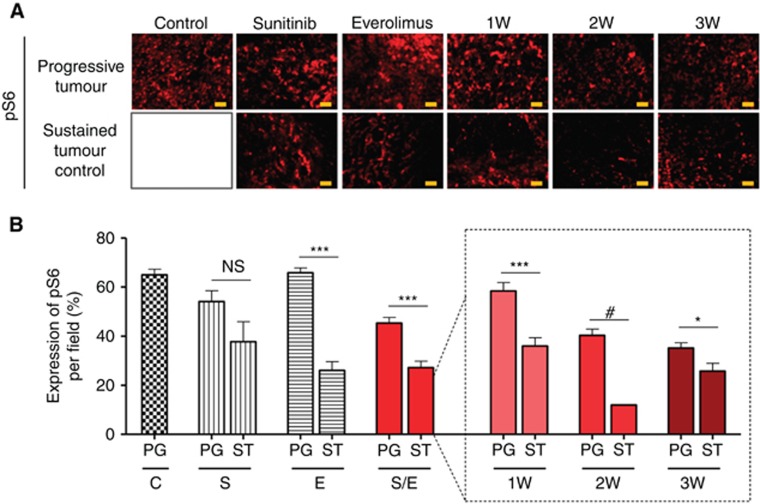
Figure 4.
Immunoflorescence analysis of Caki-1 tumour sections stained for pS6. Representative pictures of pS6 staining for each group of treatment (A). Protein expression was quantified by Image J software for mice with tumours treated with vehicle control (C), 60 mg kg−1 per day sunitinib (S), 10 mg kg−1 per day everolimus (E), sequential combination of 60 mg kg−1 per day sunitinib, and 10 mg kg−1 per day everolimus as a single group (S/E) composed with treatment of alternate drugs administration every week (1W), every 2 weeks (2W), and every 3 weeks (3W). For each treatment group a double bar graph represent in one hand the mice that experienced quick progressive disease (PG) and in the other hand the mice with sustained (ST) tumour control. Values represent the means±s.e.m. of at least five quantifications per animal, ***P<0.005, **P<0.01, *P<0.05, NS=non significant, #symbol stands for no calculable P-values due to the small sample number (B).

