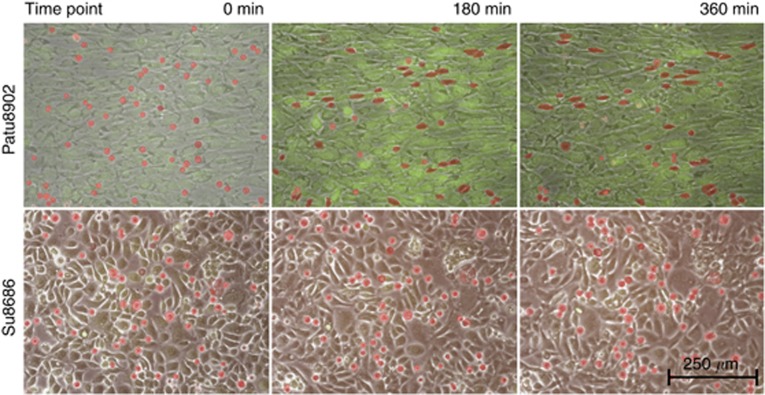
Figure 1.
Sequences of different integration patterns. Suspended PDAC cells were stained with Cell-Tracker-Red (Invitrogen) and added to a confluent HMC monolayer, which is stained with Cell-Tracker-Green (Invitrogen). Fluorescence pictures using the appropriate wavelength and control pictures in low light intensity were obtained. The three pictures of the two sequences represent 0, 180 and 360 min examination time. The carcinoma cells are highlighted in red owing to the difficulty to identify them in motionless pictures when integrated into the HMC layer. These highlights were used as the basis for the partly automatic, partly manual morphometrical analyses (see Figure 2A). The upper sequence shows an example of the observed migration pattern of cell lines with PDAC cell elongation (Patu8902). Most carcinoma cells show round or nearly round shapes at the beginning (0 min). The following pictures of the series (180 and 360 min) illustrate the changes of most carcinoma cells toward an elongated shape and their integration into the mesothelial monolayer. The lower sequence illustrates the migration pattern of Su8686 exemplarily for cell lines without tendencies to elongate. Only marginal changing of the initial round cell shapes is observed over the entire examination time.

