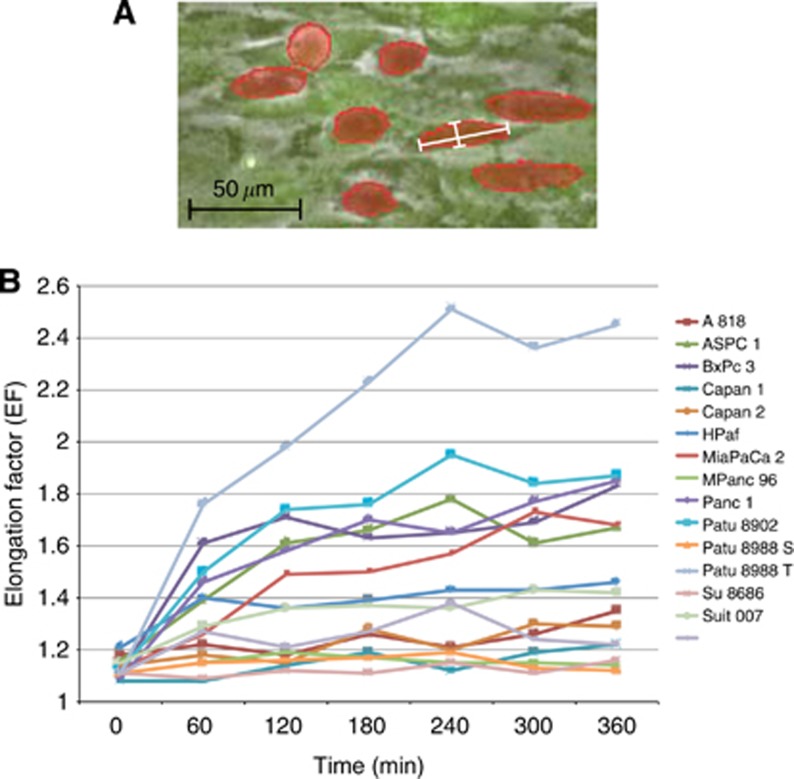
Figure 2.
(A) Illustration of EF measurement. The details of the microscopy picture illustrate exemplarily how the EF was calculated. The PDAC cells were marked red along their cell margins. (B) EF development. Development of the EF of PDAC cell lines plotted against time. This diagram excludes standard deviations for better readability. Once elongated, the cells showed no tendency to relinquish this development and to revert to their initial round shapes.

