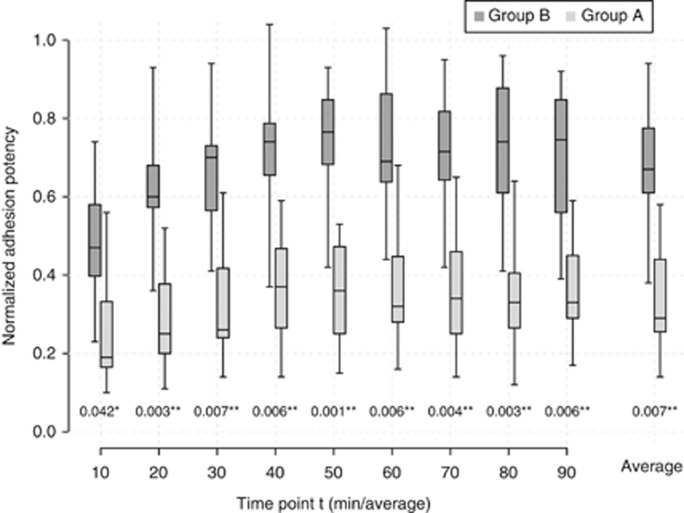
Figure 3.
Adhesion assay. The PDAC cell lines were classified by MEF into group A (dark grey) and group B (light grey). Boxplots illustrate the mean normalised adhesion potencies of the two groups plotted against time at every time point of measurement and in toto. Significantly increased adhesion potency for group A (*P<0.05; **P<0.01) was observed for each time point.

