Figure 5.
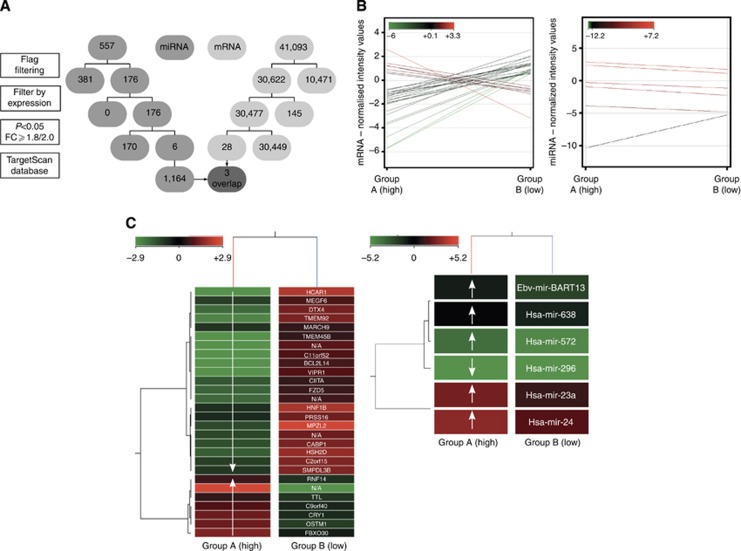
(A) Flowchart of microarrays. The flowchart displays the four steps of the microarray analysis for miR (middle grey) and for mRNA (light grey), and the subsequent reduction of the initially detected mRNA/miR. The final overlap is highlighted as dark grey and arrows. (B) Profile plots of microarrays. Profile plots show the mRNA/miR expression profiles for entities with a fold change cutoff of ⩾2.0/⩾1.8. The normalisation algorithms, baseline transformation in case of mRNA microarray, flag filtering, subtraction of non-changing entities (range +0.5 to −0.5) and performed moderated t-test (P-value cutoff <0.05) were conducted previously. The normalised intensity values are displayed according to an analogically coloured scale with a 100% range and an asymmetric centre. A total of 28 mRNAs were differentially regulated in the two examined groups. Seven mRNAs were significantly upregulated and 21 downregulated in group A. In all, 41 065 initially detected mRNAs were excluded by filtering. Five miRs were significantly upregulated and one downregulated in group A. Five hundred and fifty-one miRs were previously eliminated. (C) Heat maps of microarrays. Heat maps demonstrate two-dimensional dendrograms of the differentially expressed entities related to the provided groups. The hierarchical structure of the mRNA/miRs correlates with the averaged metric distances of the entities to each other. The mRNA/miR normalised intensity values are displayed according to an analogically coloured scale of reduced ranges (intensity value range: mRNA, ±2.9; miR, ±5.2) with a symmetric centre. In addition, the names of the identified mRNA/miRs are listed. Exposed genes and miRs – resulting from the performed overlap – are marked in bold type.

