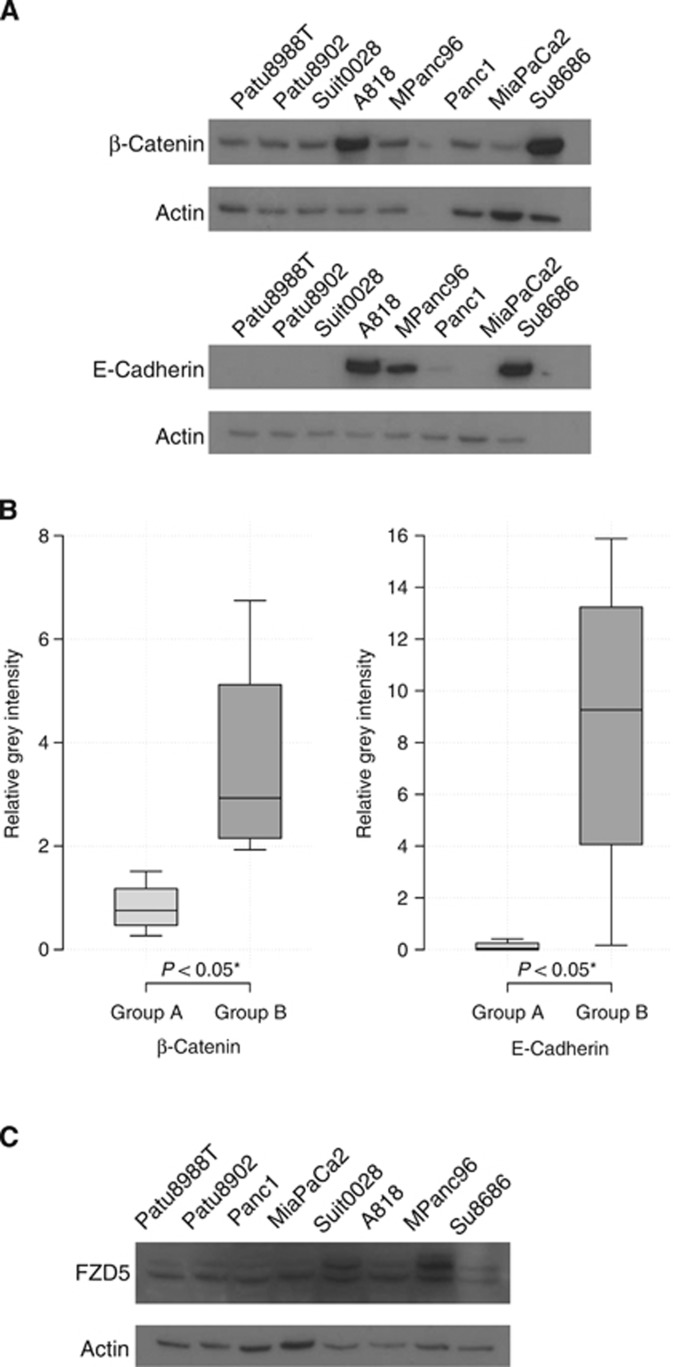
Figure 6.
(A) Western blot. Western blots of β-catenin and E-cadherin were performed for four representative cell lines in each group. Actin was used as the reference. (B) Western boxplots. Expression level is displayed as relative grey intensity. E-cadherin was significantly more expressed in group B cell lines (8.65±6.55) vs group A cell lines (0.13±0.20) (*P<0.05). Likewise, the expression of β-catenin was significantly lower in group A (P<0.05) than in group B (group A, 0.82±0.52; group B, 3.63±2.18). (C) Western blot. Western blots of FZD5 were performed for four representative cell lines in each group. Actin was used as the reference. FZD5 showed a significant electrophoretic shift towards slower mobility in group B vs group A (*P<0.05).

