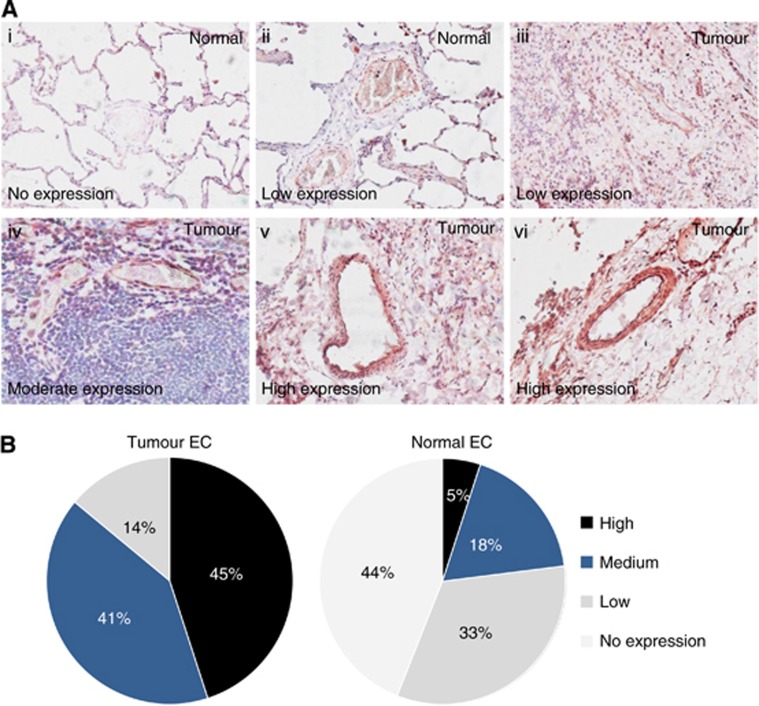
Figure 6.
Expression profiling of STEAP1 expression in clinical lung cancer samples. (A) Representative images of STEAP1 in healthy (i–ii) and tumour (iii–vi) lung tissue; expression level classified as no expression (i), low (ii–iii), medium (iv) and high (v–vi). Images were acquired using an optical microscope at a magnification of × 20. (B) Expression profiling of STEAP1 in clinical samples by immunohistochemistry (n=82).

