Figure 1.
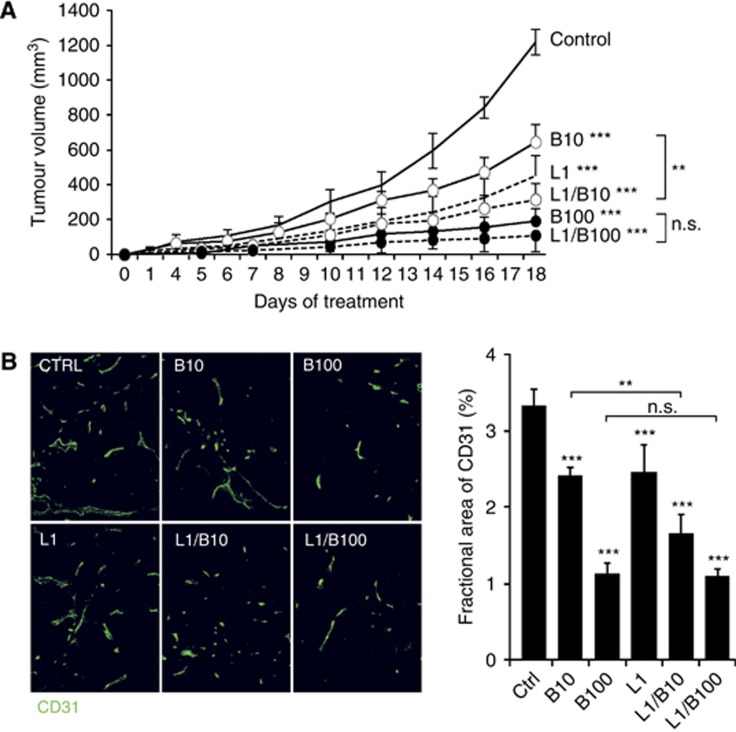
Xenograft tumour growth and vascularity in response to VEGF and Ang2 inhibition (A) Tumour growth of LS174T xenografts in mice treated with full dose 5 mg kg−1 (B100) or low dose 0.5 mg kg−1 (B10) bevacizumab or the Ang2 inhibitor (L1) and combinations thereof (L1/B10 and L1/B100). (B) Fractional area of CD31 immunoreactivity corresponding to endothelial cells in histological tumour sections cut through the centre of each tumour at the end of the treatment period. Overall, the reduction in vessel area density in the treatment groups mirrors their growth kinetics. Symbols above individual bars indicate statistical significance vs the control group. Symbols above brackets indicate the statistical significance between these two groups. For a comprehensive statistical comparison of the treatment groups, please refer to Supplementary Table 1. ***P≤0.001, **P≤0.01.

